Trace detail
Open one trace to dissect the run: every span it produced, what each span cost, and why the run succeeded or failed. This is where you go after the list narrows you down to a single run worth understanding.
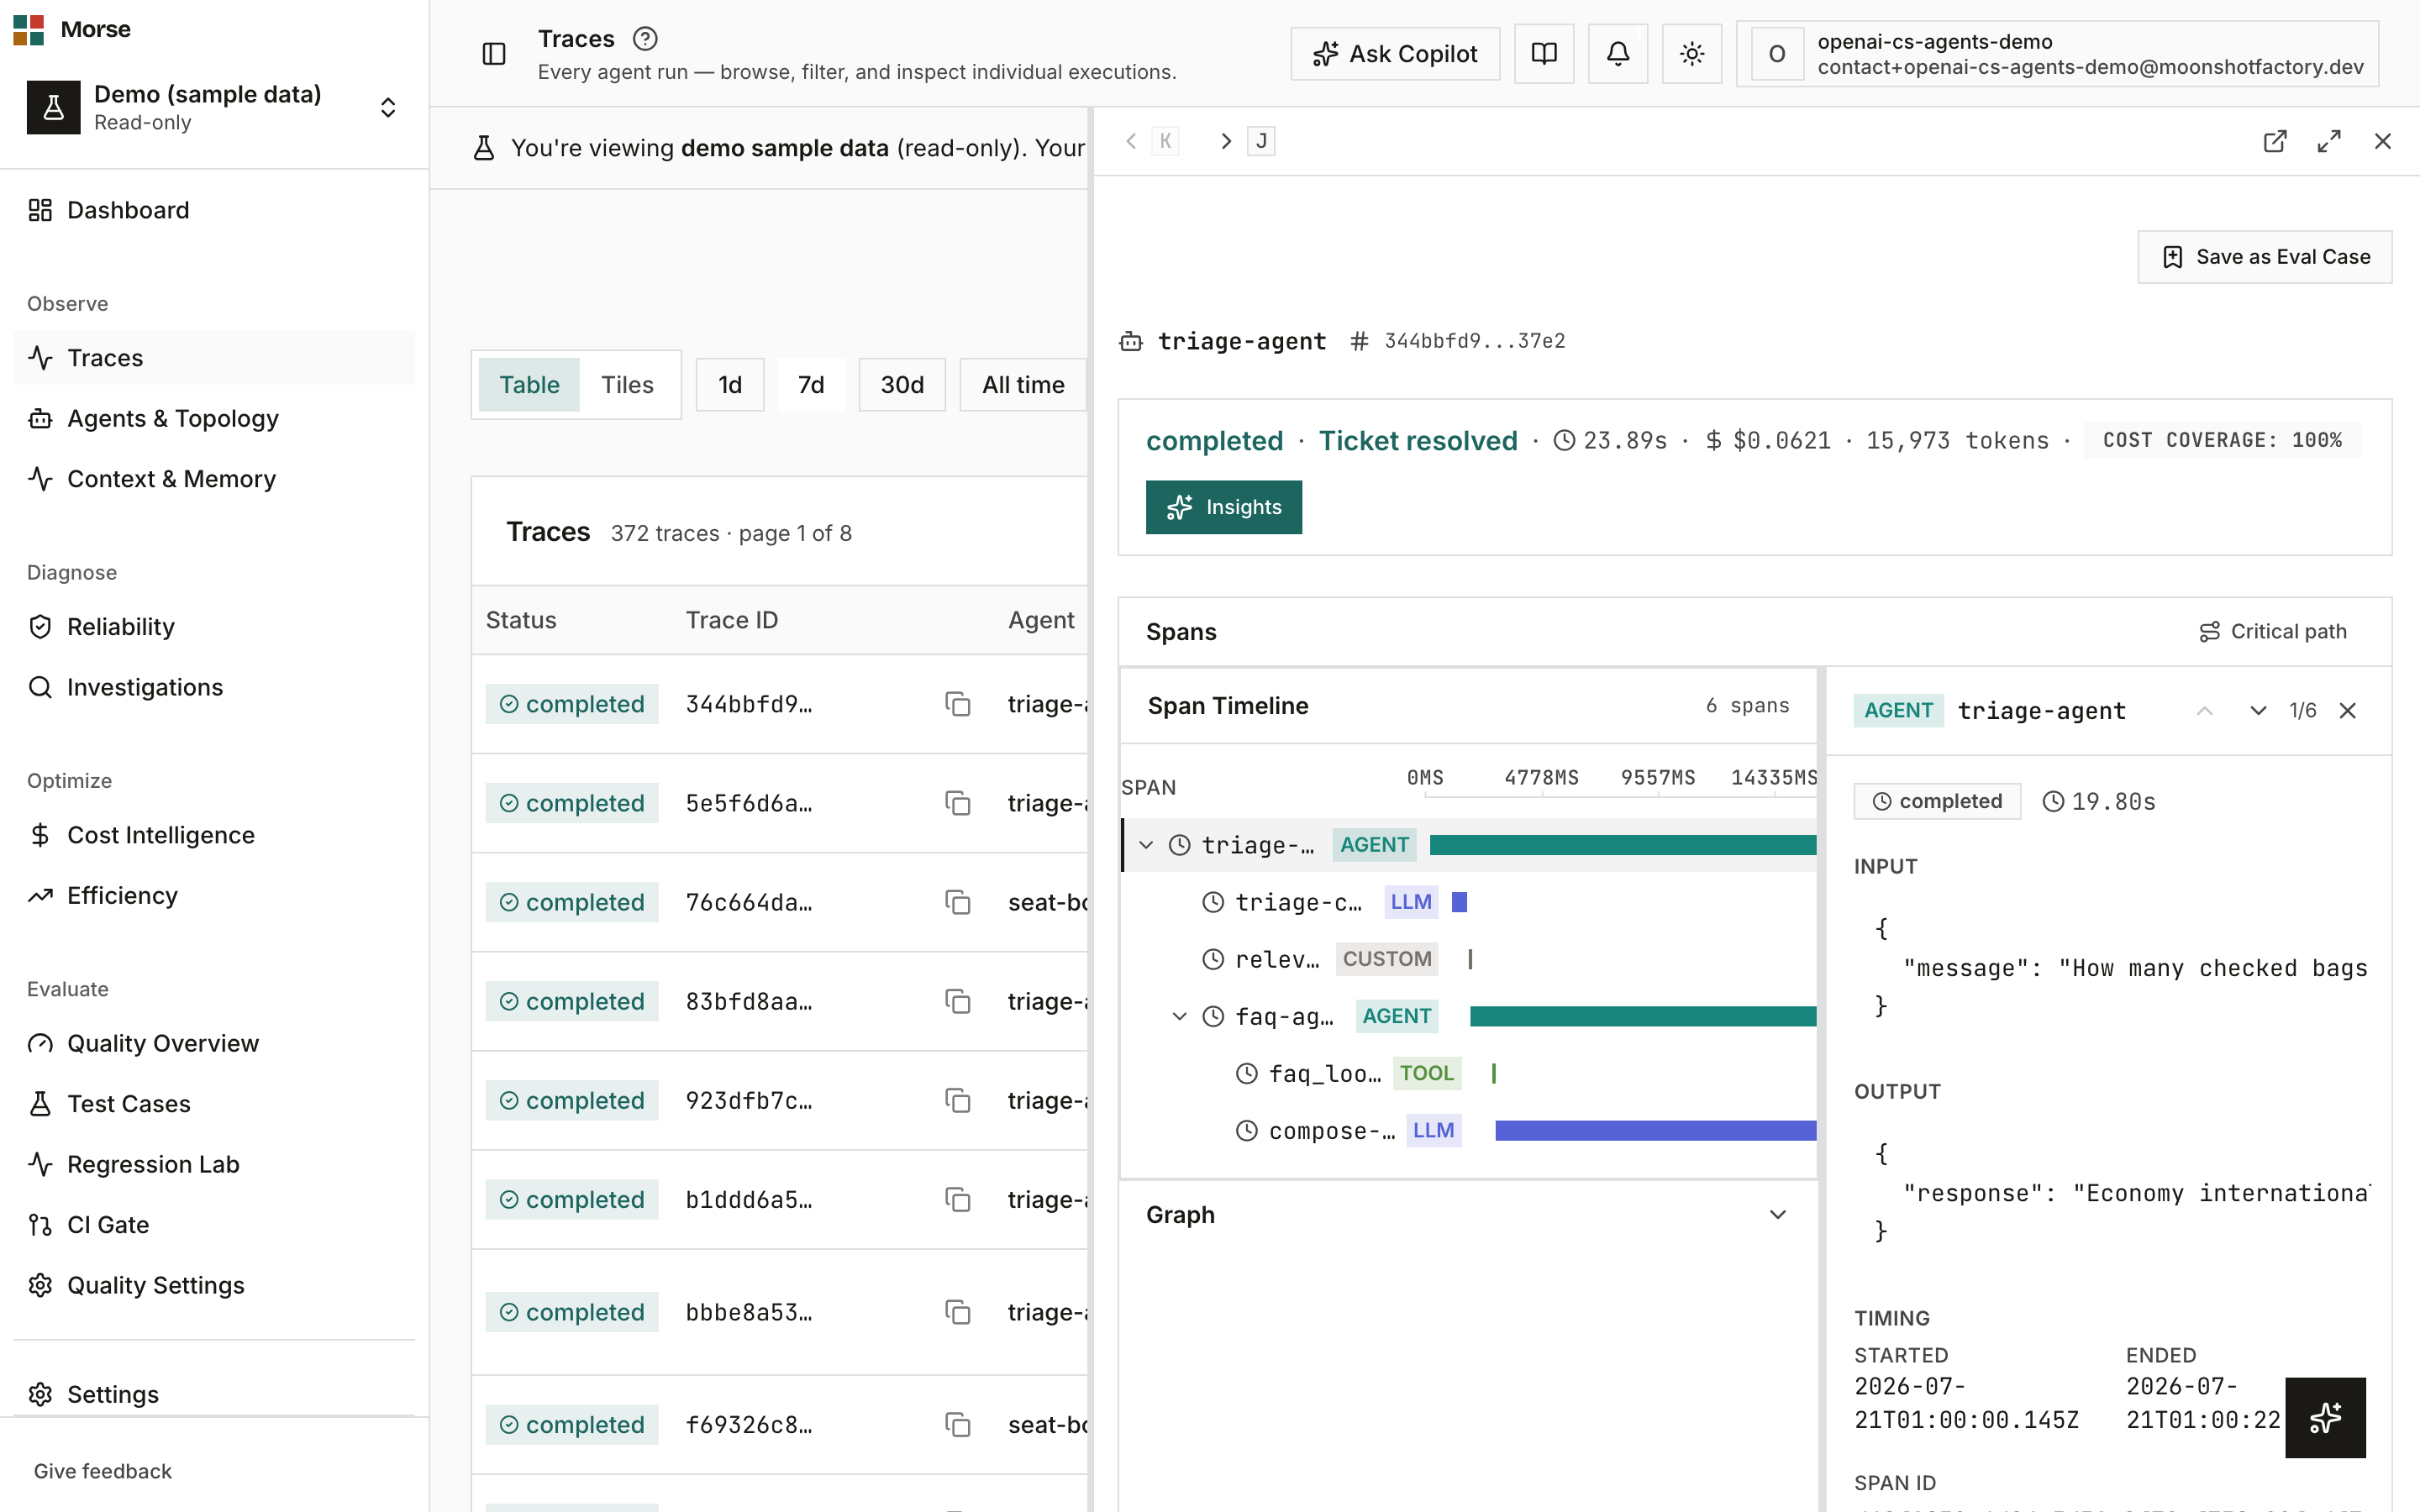
Trace detail is not a second page. /traces/[traceId] opens as a resizable, closable peek
overlay on top of the still-interactive list. A deep link to /traces/[traceId] lands directly
on that overlay.
What you see
Identity
An identity row: the agent name, the trace ID, and — when the run reported it — the git revision as a short seven-character hash.
Git revision appears here on the detail; it is not a column on the trace list.
Verdict strip
One line carries the whole verdict: status · outcome · duration · cost · tokens, plus an optional Cost Coverage badge when a coverage score exists. Status and outcome take an earned color — red when the run failed, teal when it succeeded, neutral for anything in between; never a decorative color.
The strip also holds the single filled Insights button (see below).
Spans (the default body)
By default the body is a spans master-detail. On the left, a waterfall/tree of the run’s spans; on the right, a detail panel for the selected span showing its input and output (LLM content, SQL statements, retriever results), timing, and span ID. Controls above the waterfall:
- A Flat / Tree toggle — shown only when the run spawned sub-agents.
- A Critical path highlight toggle.
- A collapsed Graph (DAG) accordion beneath the waterfall.
Insights (the analytics body)
The Insights button swaps the spans body for an analytics stack — no navigation. Each panel self-gates and renders nothing when the trace has no data for it, so the stack you see reflects what this run actually produced. Panels include cost-coverage KPI, an unpriced-spans badge, an estimated infra-cost line (kept separate from priced cost), an outcome signal with provenance, SDK capability chips, extracted operational signals, eval scores, a Context X-Ray card, a context×outcome insight, a memory-ops panel, a cross-agent context-flow panel, orchestration stats, a collapsible orchestration detail (role tree + tools used), a metadata viewer, a token-utilization chart, and a correlation panel.
Multi-agent structure in the orchestration detail is displayed using a fixed eight-role canonical ontology — Run, Agent, Step, LLM, Tool, Memory, Router, Guardrail — that framework-specific spans are classified into. The label you see is the canonical role, not the source framework’s own term for that node.
How to use it
- Click a span in the waterfall, tree, or DAG to select it and read its detail.
- Toggle Flat / Tree and Critical path; drag the master-detail split to rebalance.
- Toggle Insights to swap between the spans view and the analytics stack.
- Use the overlay chrome to navigate prev / next trace (K / J keys), open the trace in a new tab, toggle fullscreen, or close.
- Record or update an outcome, save the trace as an eval case (or jump to its eval cases), and trigger “Explain this agent” (Copilot) from inside Insights.
Before you have data
The detail is honest when a run has nothing to show:
- Null duration or cost render as an em-dash (—), never a fabricated
0. - If a run’s spans were hard-deleted after your plan’s retention window (but the run was priced), a “Span data expired” notice explains why the waterfall is empty and points to upgrading.
- A failed run shows a “Trace failed” alert with its error message (or “No error message available” when none was reported).
- While loading, a skeleton renders; on a load error, a Retry button; on a missing trace, “Trace not found.”
Related
- Traces — the list this overlay opens from.
- Copilot — where “Explain this agent” sends its prompt.
- Cost Intelligence — cost per outcome across all runs, not just this one.