Investigations
When a Reliability alert fires, an agent runs a multi-step root-cause investigation automatically — pulling in infra signals, a baseline comparison, recent changes, sample failed traces, and correlated alerts — and hands you back a hypothesis, a confidence level, and the evidence behind it. This screen is the command center: a queue of every investigation, and a detail pane for the one you’ve selected.
What you see
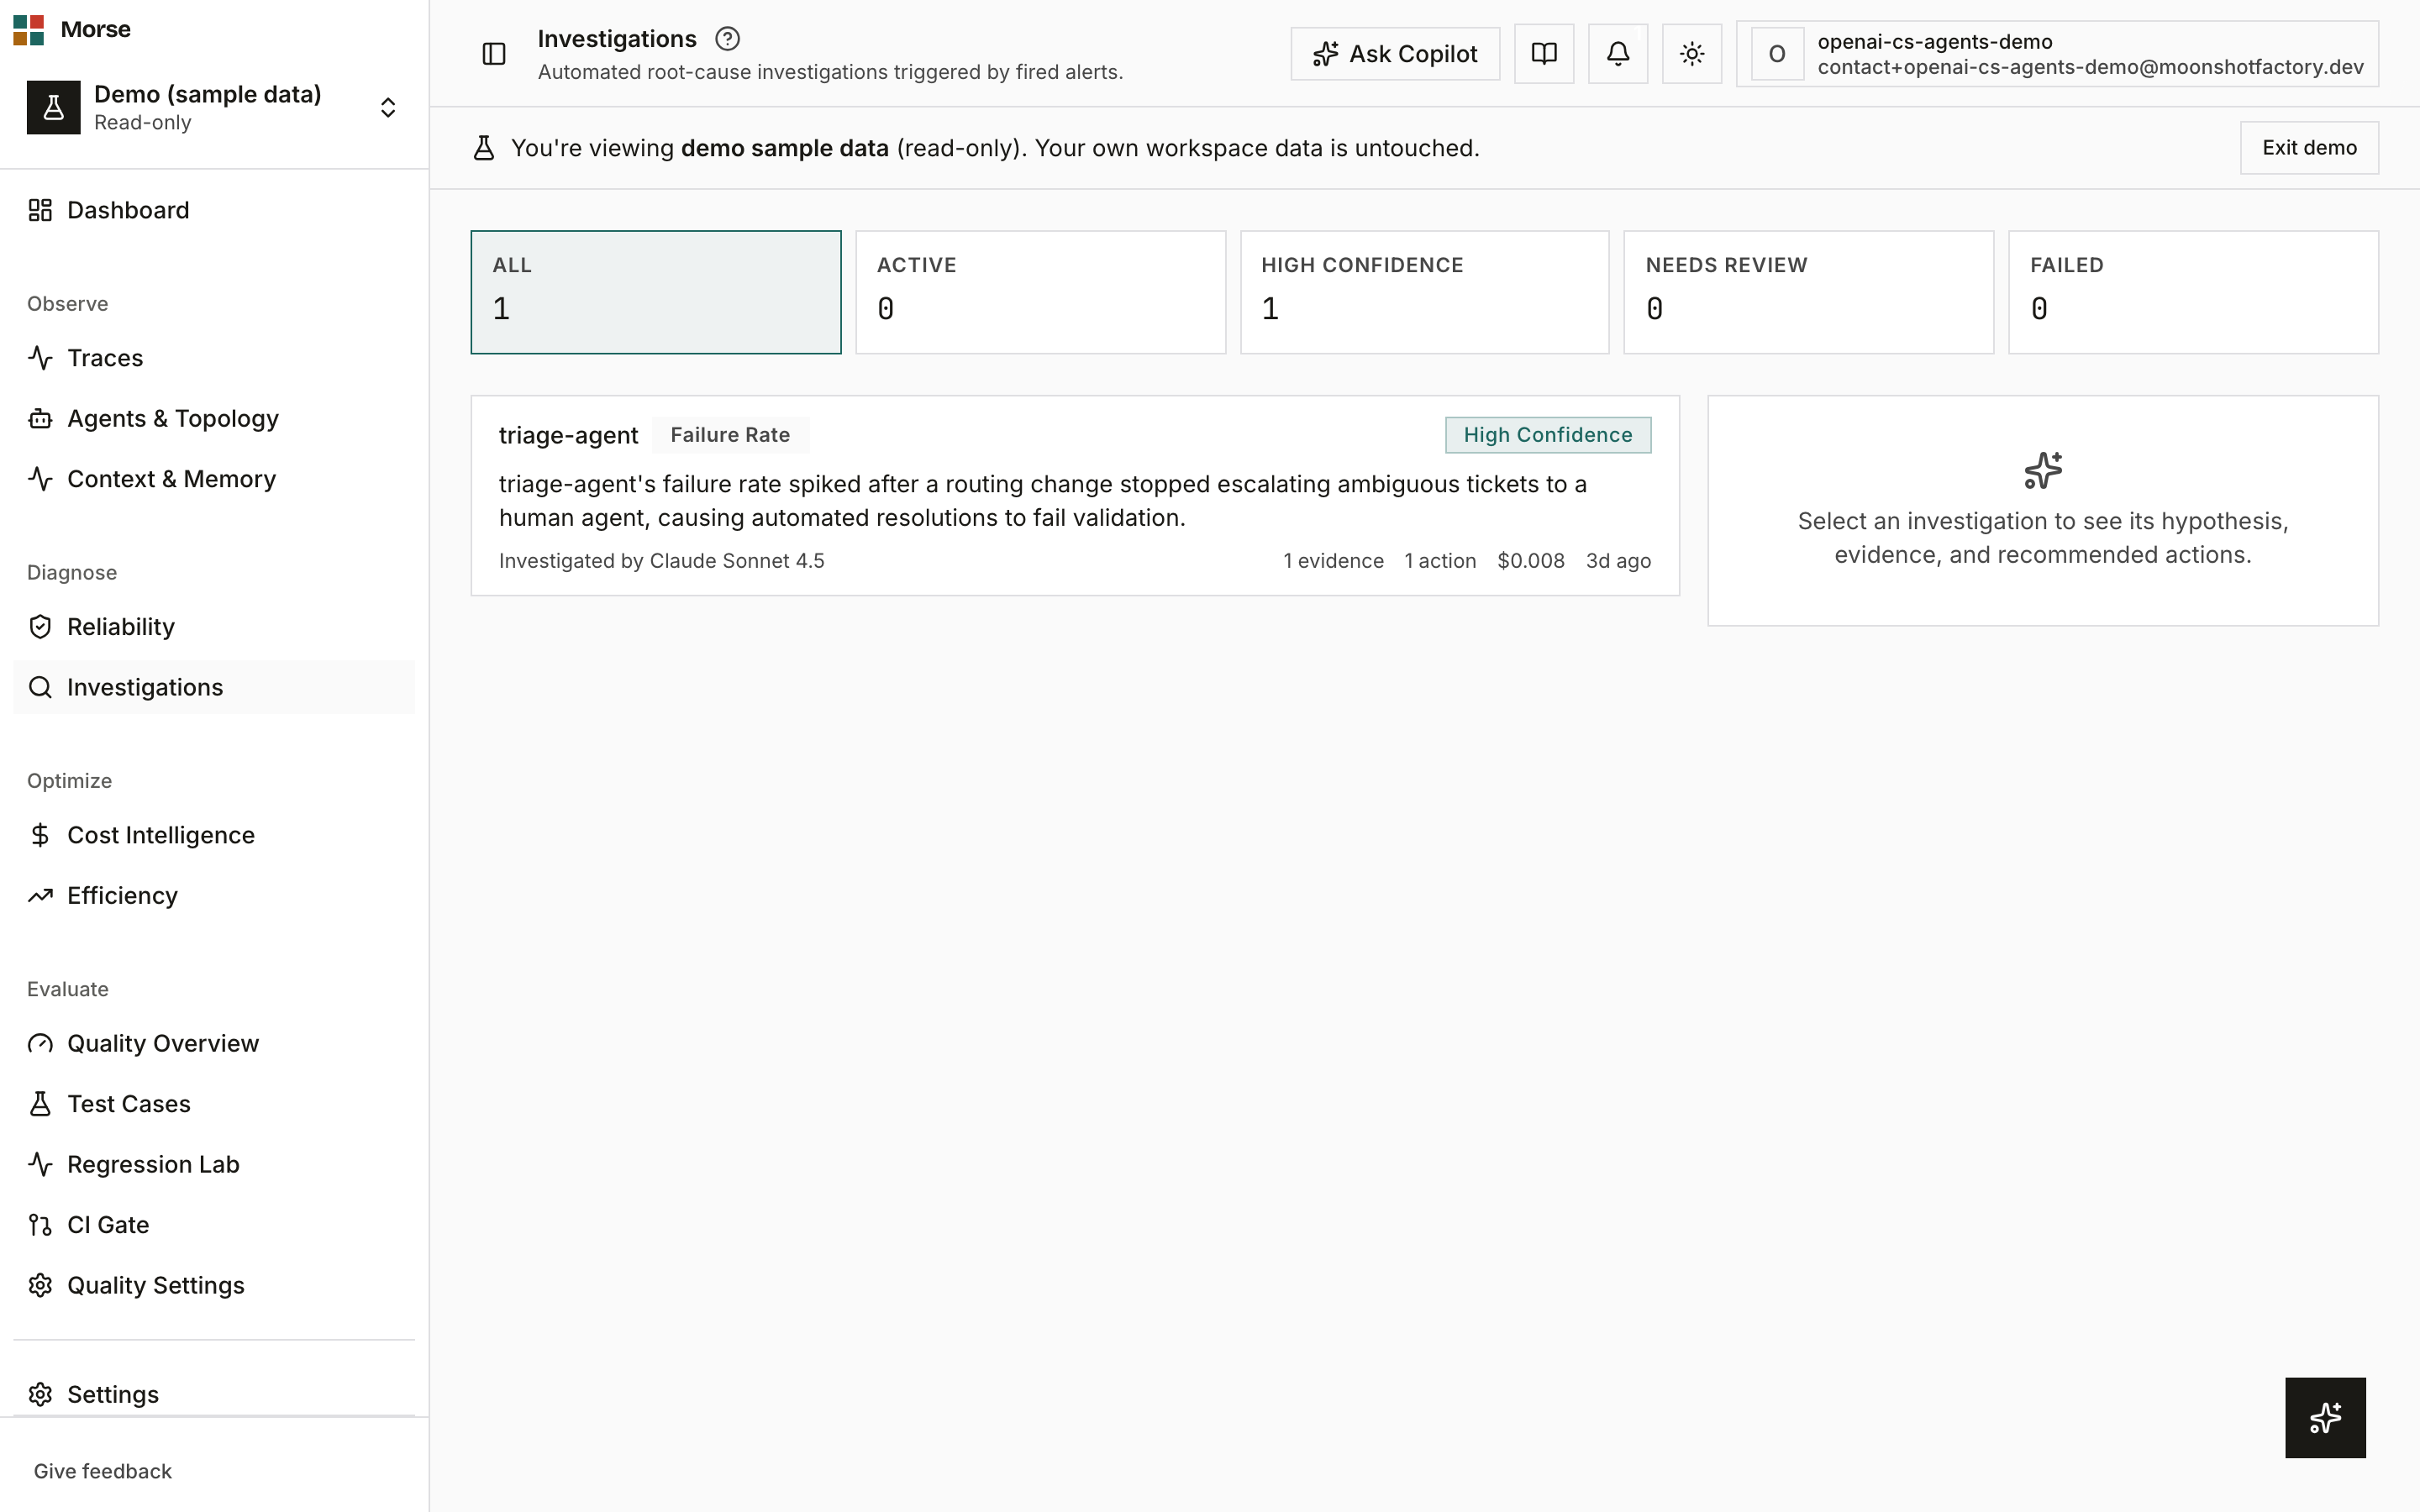
The page renders a summary strip above a two-pane layout: a state-aware queue on the left, a detail preview on the right.
Summary strip
Five clickable tiles — All, Active, High confidence, Needs review, Failed — each showing a server-computed count.
Clicking a tile filters the queue below to that segment. The bucket itself is decided once on the backend — the same function backs both the per-row segment and this aggregate count, so the tile counts and the rows in the queue never disagree.
Investigation queue
Each row shows the agent name, an alert-type badge, a status or confidence badge, a one-line hypothesis, who investigated it (a specific model name, or “Morse AI” as a fallback), evidence count, recommended-action count, cost, and how long ago it ran.
A run that hasn’t landed a high-confidence hypothesis reads “Couldn’t form a confident hypothesis — needs review,” in italics, rather than showing a shaky guess as if it were settled.
Detail panel
Selecting a row opens its hypothesis, evidence grouped by kind (Traces, Metrics, Logs, Changes, Alerts, Evals), a numbered list of recommended actions, and a run-facts grid — status, model, cost against its cap, and duration.
An action rail lets you jump to the fired alert, the referenced trace(s), Copilot (with a pre-filled prompt about this investigation), the Reliability SLO config for burn-rate alerts, or Evals when eval evidence is present.
On narrower screens the detail panel opens in a bottom sheet instead of a side pane.
Cost and confidence
Each investigation runs against a per-run dollar cost cap — $0.05 by default, about a nickel, unless your organization or a specific alert overrides it.
A run that hits its cap stops rather than overspending, and still saves whatever partial result it had — it doesn’t fail silently.
How to use it
- Click a summary tile to filter the queue to that state.
- Click a row to load its hypothesis, evidence, and recommended actions in the detail pane.
- From the detail pane, jump to the alert, the trace(s) referenced as evidence, Copilot, Reliability, or Evals.
- Arriving from a fired alert with
?alert_id=in the URL preselects that alert’s investigation in the detail pane automatically.
Before you have data
Until an alert fires, the queue is honest about being empty:
- No investigations yet: “No investigations yet.”, with a short explainer of how investigations work and links to configure an alert or inspect recent alerts.
- A filtered segment with no matches: “No investigations match this filter.”
If the request to fetch investigations fails outright, the queue shows a “Couldn’t load investigations” state with a Retry button.