Traces
Every agent run becomes a trace — an ordered record of every LLM call, tool call, database query, and HTTP request the run made. This screen is the list: scan a cohort of runs, filter it down to the ones you care about, and open one without losing your place.
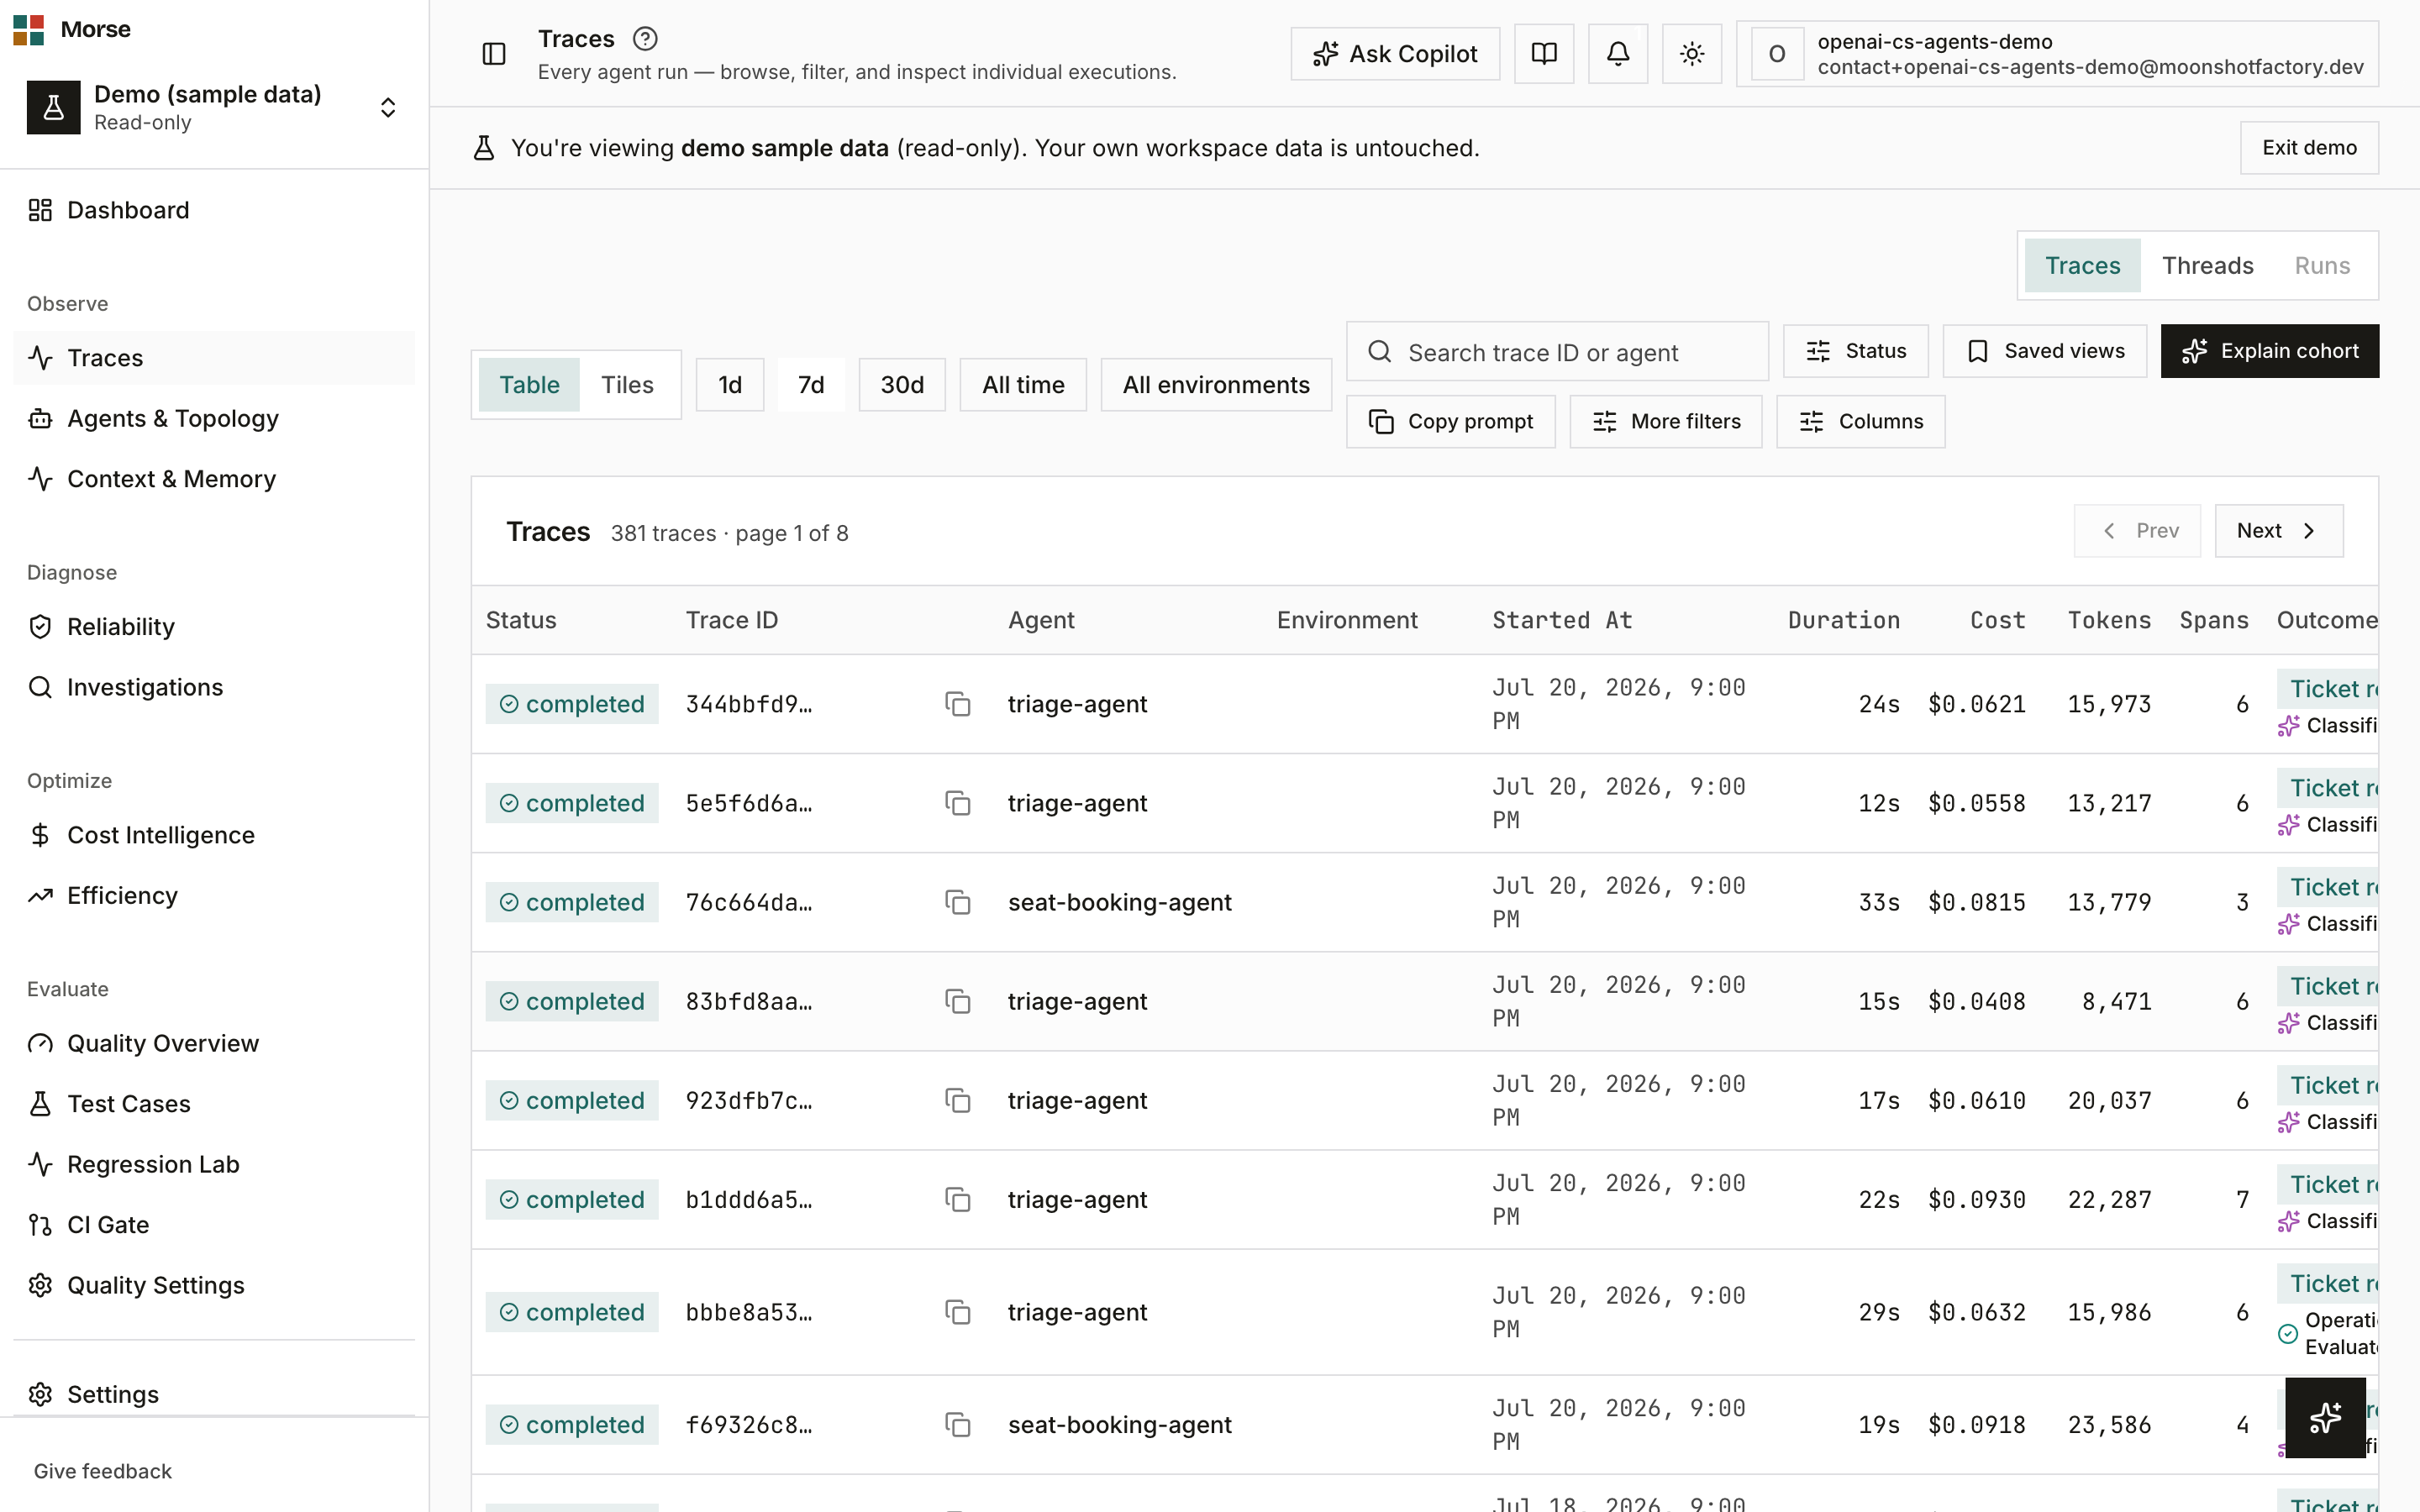
What you see
The grid mounts once and stays put while you drill into individual traces — opening one never navigates away from the list.
The toolbar sits above a results panel; the panel is a table or a tile grid depending on the view mode.
Dataset and view mode
Two toggles decide what the grid lists and how it draws it:
- Dataset mode — Traces, Threads, or Runs. Traces lists individual runs; Threads groups related runs (e.g. a multi-turn conversation) into one card each. Runs is disabled — it is a planned dataset, not a live one.
- View mode — Table or Tiles. Table is the dense, sortable, column-configurable view; Tiles is a card grid.
Filters
- A time window row: 1d / 7d / 30d / all. The default is 7d.
- A search box and a Status dropdown.
- An environment filter pill — shown only when the workspace has more than one environment.
- A More filters popover: sort, success, date range, agent, thread ID, user ID, cost range, duration range, and an include-telemetry toggle.
- A Columns popover (table mode only) to choose which columns show.
Sort offers ten options, including highest cost, longest duration, most tokens, most spans, highest context use, and most eval failures.
Saved views
A Saved Views menu holds two kinds of view. Five built-in presets are always available and computed client-side: Expensive failures, Slow successful runs, Context bloat candidates, Eval failures, and Cost coverage gaps.
Views you create yourself are saved on the backend (scoped to your org) so they persist across reloads and teammates.
Results
In table mode each row shows status, trace ID, agent, duration, cost, tokens, span count, outcome, eval, context, and signals cells. Threads mode swaps rows for thread cards with turn count, cost, tokens, an eval summary, and first/last input previews.
How to use it
- Switch dataset and view mode to change what and how you scan.
- Narrow the cohort with search, status, time window, environment, or the More-filters popover; sort to bring the worst offenders to the top.
- Apply a built-in preset or save your own filtered cohort as a view you reuse daily.
- Page through results with Prev / Next (50 per page).
- Click any row or tile to open that trace in the peek overlay on top of the still-interactive list.
Explain and copy cohort
Two buttons hand the current cohort to Copilot: Explain cohort sends a built cohort-summary prompt straight into Copilot, and Copy prompt copies that same prompt text to your clipboard.
If a refresh fails, the grid keeps the last-good rows on screen with a small retry affordance instead of blanking the table.
Before you have data
Until a run lands, the grid is honest about being empty rather than faking rows:
- No traces yet: “No traces yet. Send your first trace to populate the grid.”
- Filters that match nothing: “No traces match the current grid filters.”
If the whole cohort fails to load and there is no last-good data to fall back on, the grid shows a “Failed to load traces” state with a Retry button.
To get your first trace here, follow the quickstart.
Related
- Trace detail — open one run and dissect its spans.
- Copilot — where “Explain cohort” sends its prompt.
- Agents — the same runs, rolled up per agent.