Dashboard
Open the dashboard and you land on one screen: what’s working, what needs attention, and what to fix first. Every section is tuned to how long the account has been sending data — a brand-new workspace sees an activation path, not an empty chart.
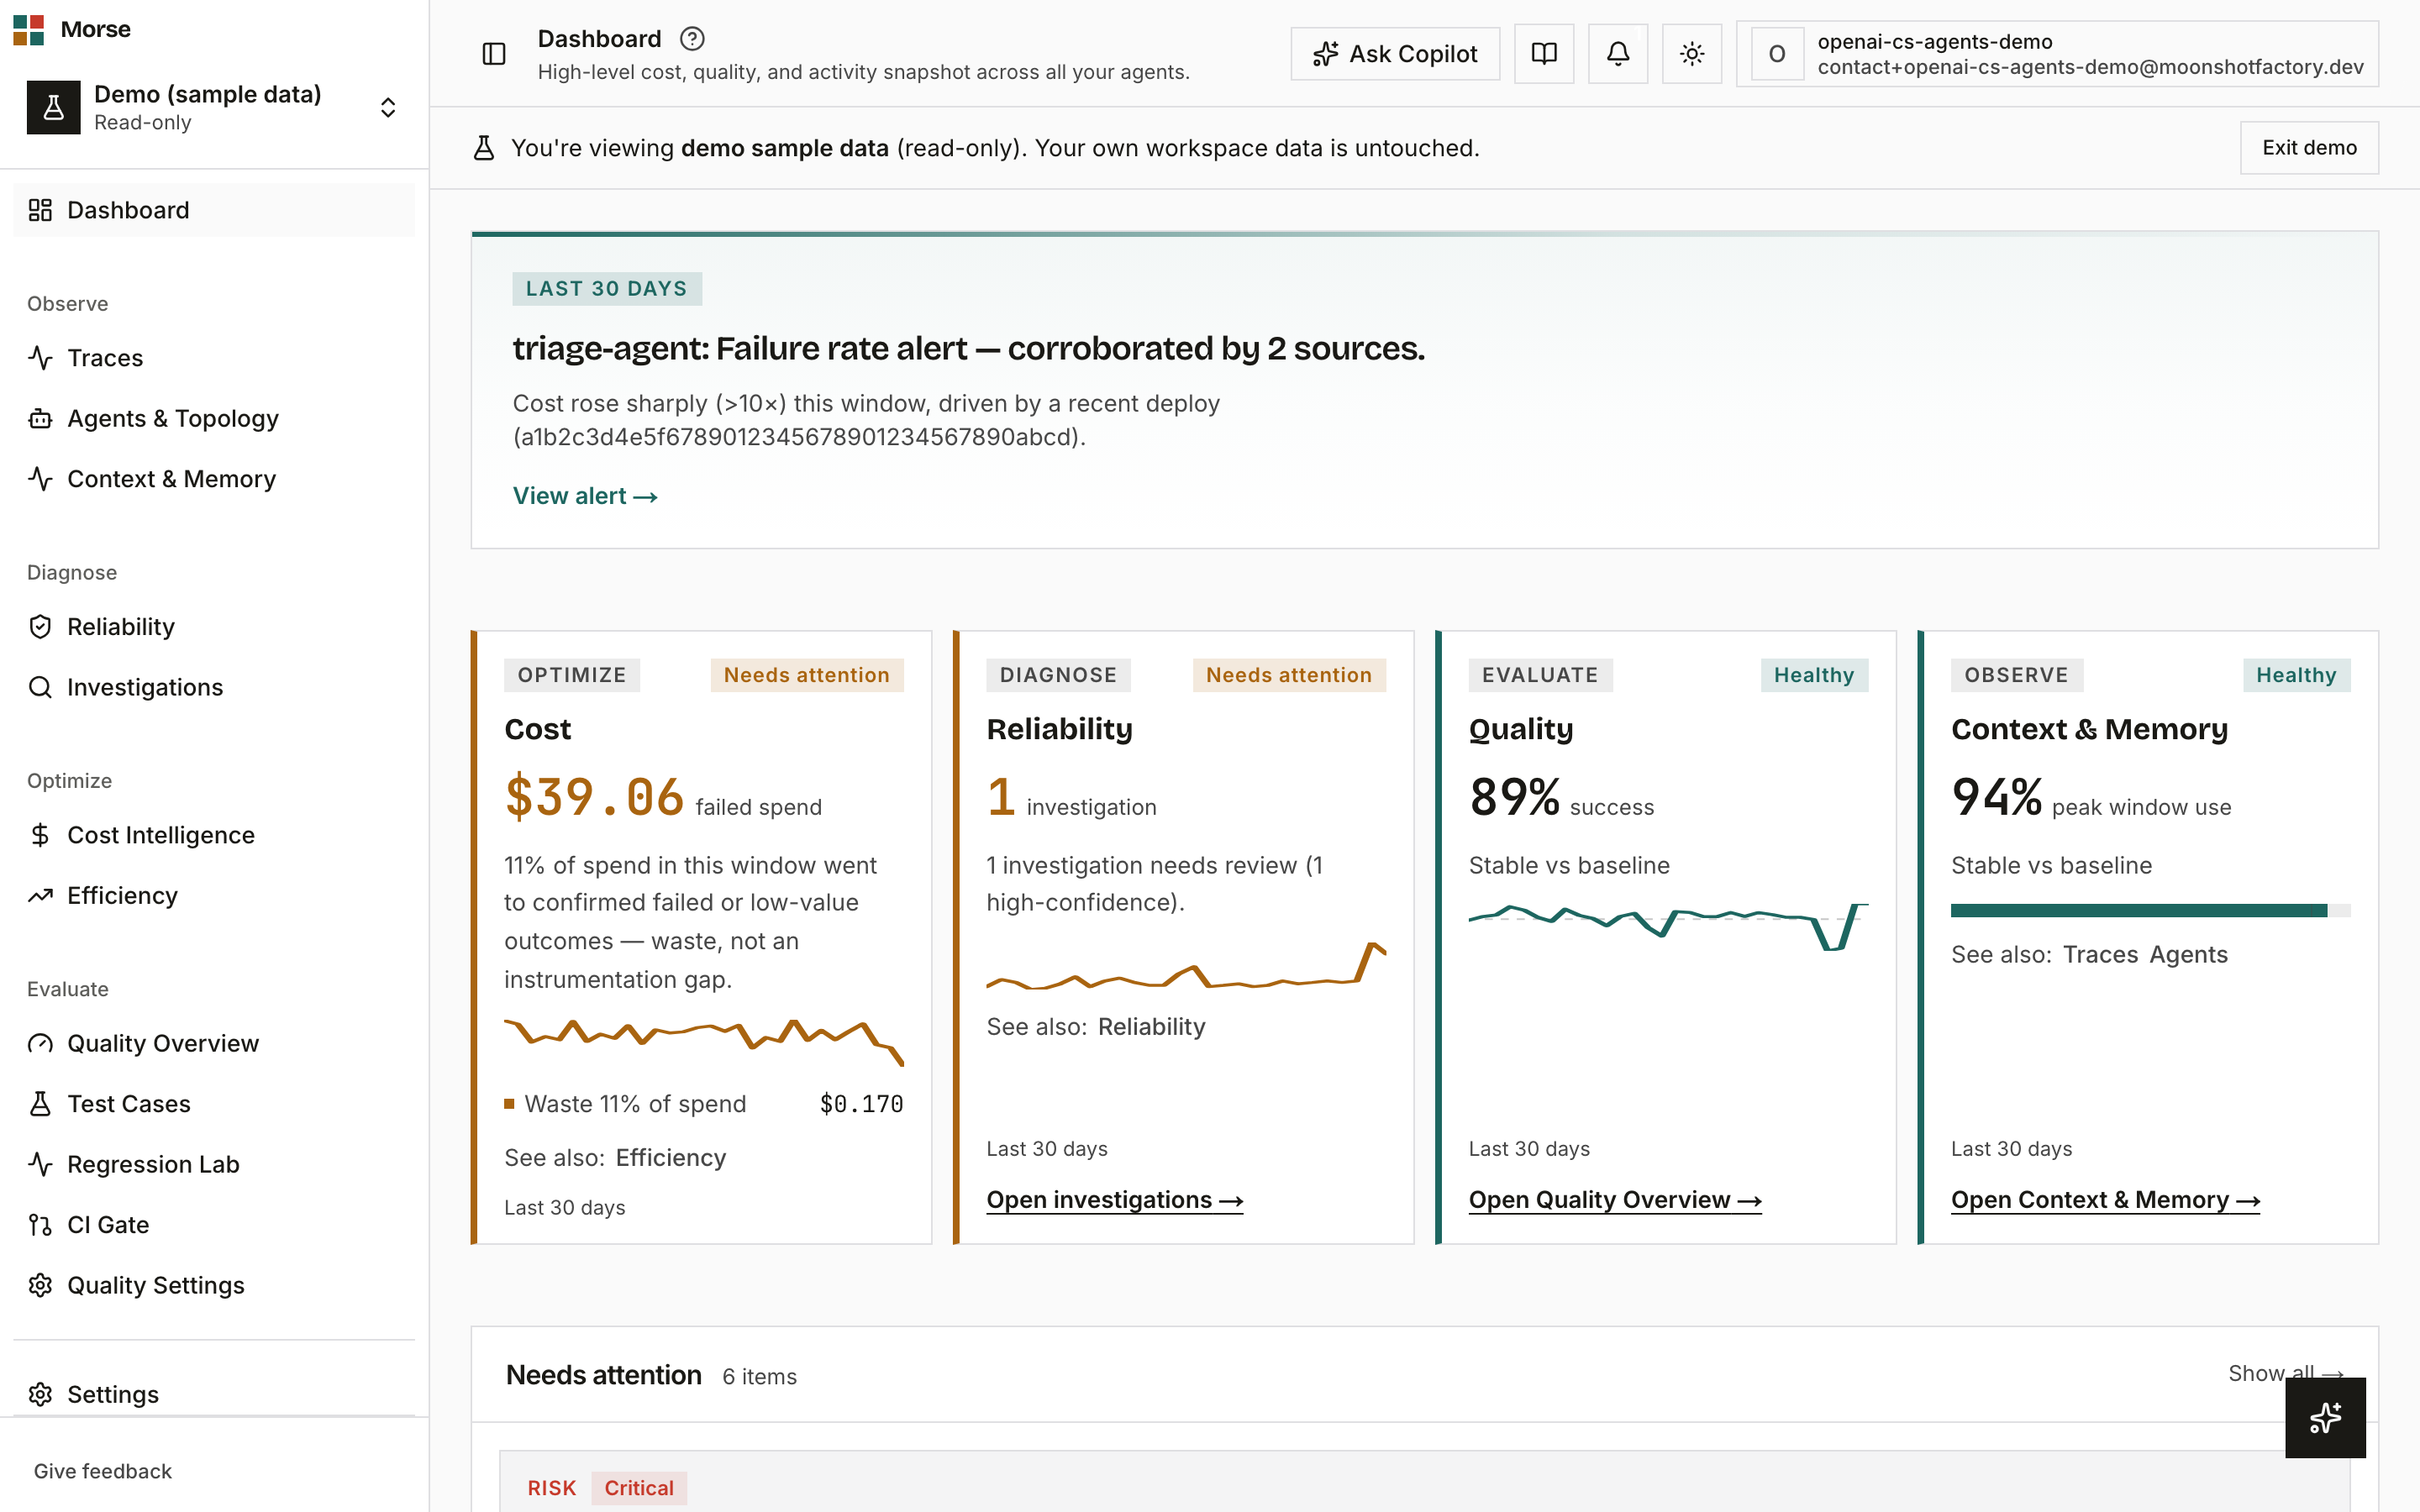
What you see
A first-run account never sees this page at all: with no API key and no first run (and not in demo mode), the dashboard redirects straight to onboarding instead.
Once there’s something to show, the page renders four sections in order, plus a footer link row.
Org Brief
A single-claim headline sitting above everything else. It hides itself entirely rather than show a loading spinner or a broken state — no brief, no lifecycle line, or a failed request all render nothing.
Early in an account’s life it shows a canned line for the account’s current stage, with its call to action always a real link, never dead-end prose. Once the account has a steady verdict to report, it switches to a server-composed headline and supporting line, with the highest-impact action rendered as a teal link.
Operating Summary
Four cards, always titled Cost, Quality, Reliability, and Context & Memory, sorted so the most urgent (blocked, then needs-attention) sorts first.
Each card carries a capability-group chip, a status chip, a hero metric, a one-line reason, its own trend visual, optional sub-signals, and a stable call-to-action link. A card that doesn’t yet have enough samples renders a gate line explaining what unlocks it instead of a verdict.
Needs attention
One merged, ranked, deduplicated worklist — every row is typed win, leak, risk, or next step, each with a severity badge and its own evidence link.
The panel also carries a persistent “N evidence items · view →” line at the bottom regardless of worklist state, and a header “Show all →” link into the failing-traces slice for the same window.
Spotlights
A fixed, curated band of up to five tiles — not a live-ranked list. Fleet context growth, this window’s prompt-cache savings (scoped to your top-spend agent and labeled with that agent’s name), auto-eval quality trend, and cost trend with deploy markers always render; a fifth, full-width Investigator tile appears only when a completed investigation exists in the window.
How to use it
- Click the Org Brief’s action link to jump straight to the evidence behind its headline claim.
- Click any Operating Summary card’s call-to-action to open that capability’s own screen.
- Click a Needs Attention row’s link to open its evidence, or “Show all →” for the full failing slice.
- Click a Spotlights tile’s title to open its home screen, or “All agents →” for the full roster.
This page is read-only — nothing here mutates data, every interaction is navigation.
Before you have data
Each section is honest about insufficient data rather than filling space with a number it can’t stand behind:
- Not enough runs yet: the Org Brief and any under-threshold Operating Summary card show a gate line naming what unlocks them, instead of a verdict.
- Nothing needs attention: “Nothing needs attention right now” / “No evidence-backed wins, leaks, risks, or next steps for this window.”
- A Spotlights tile without enough data shows its own honest placeholder, e.g. “Unlocks once an agent has run in this window.”
To get your first data on this screen, follow the quickstart.
Related
- Traces — the runs behind every Needs Attention and Spotlights row.
- Agents — per-agent detail behind the Operating Summary and Spotlights cards.
- Cost — the full picture behind the Cost card and the Cost trend tile.
- Reliability — the full picture behind the Reliability card.