Agents
The fleet view: every agent you’ve instrumented, its health, cost, and how it fits into your architecture. Open this when you want to see who’s running, who’s failing, or where the spend is going before drilling into one agent.
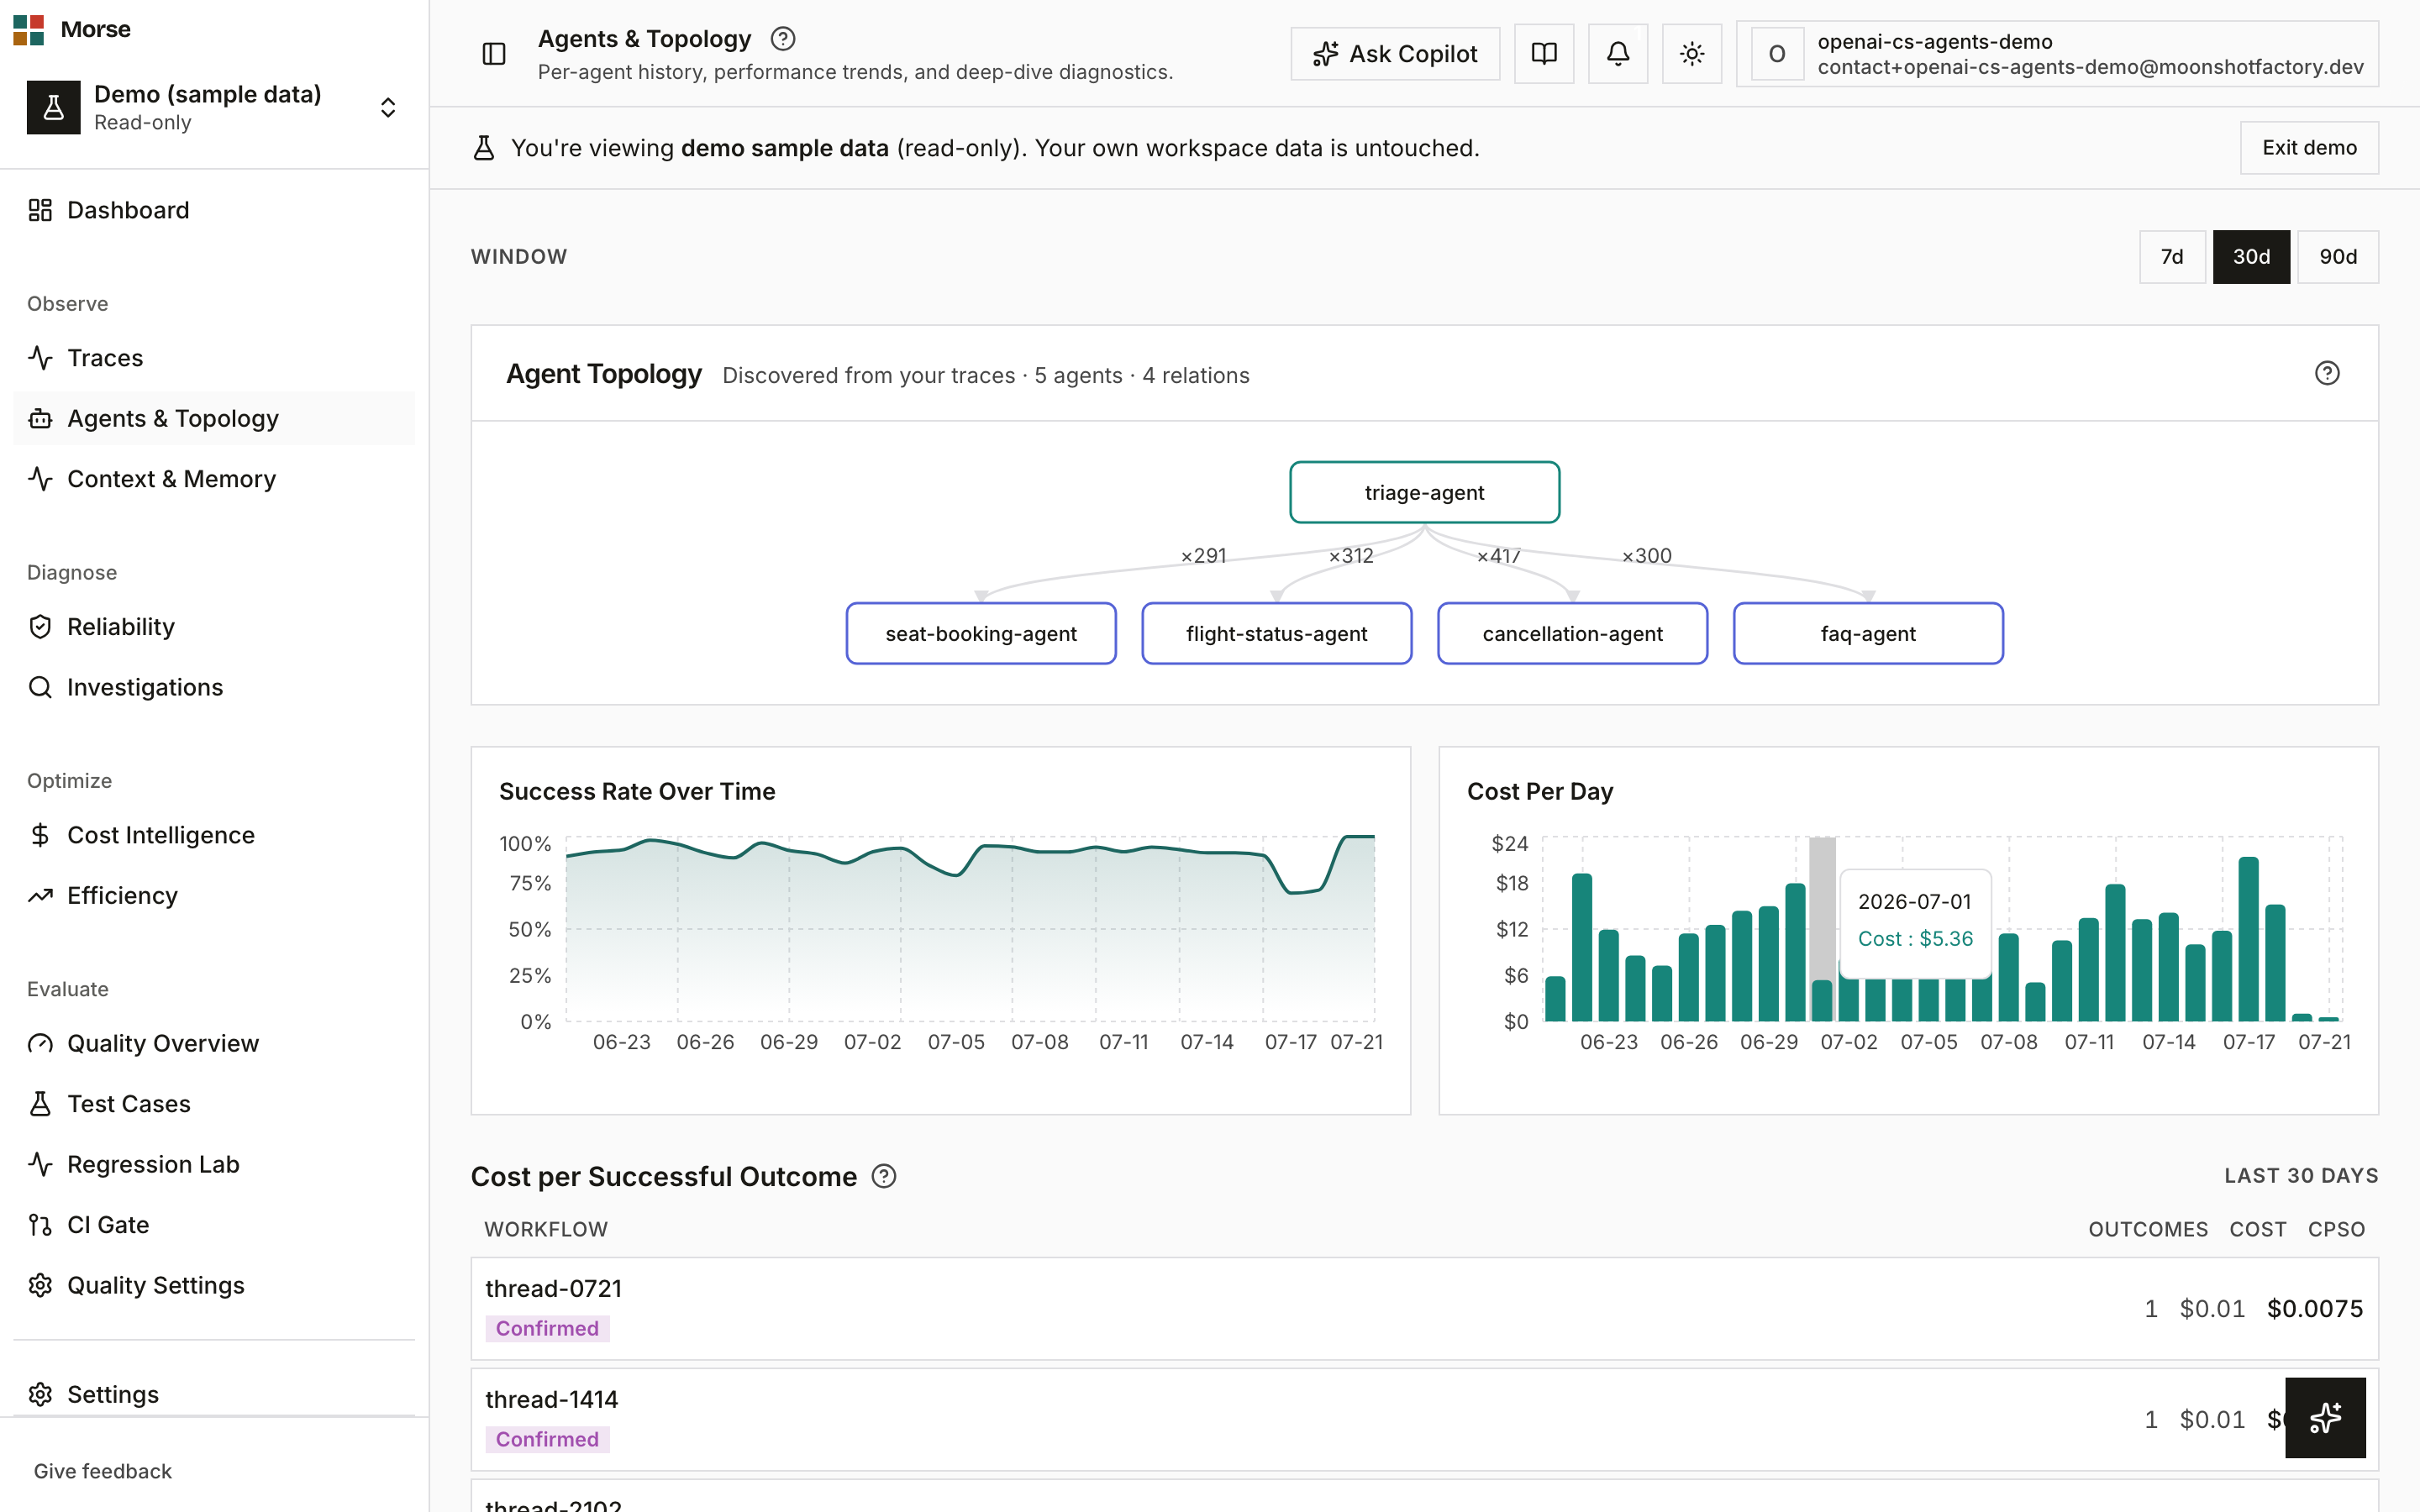
What you see
A page-level window selector scopes everything below it, followed by four sections.
Agent Topology
Your discovered agent architecture, drawn as a layered diagram once edges exist between agents, or
a flat badge list before then. Orchestrators sit on top, specialists in the middle, standalone
agents at the bottom — the layering comes from a server-computed node_type, not from guessing at
edge direction client-side.
A node can be Declared (amber, dashed border — proposed by static discovery, never actually run), Confirmed (teal — a user or a partial trace match confirmed it), or Observed (no special border — a real trace ran it). Hover any node for its status and confidence percentage.
Fleet trend
Two charts — fleet-wide success rate and cost per day — built from direct traces only, so a sub-agent’s fallback-attributed stats never get double-counted into the fleet total.
Cost per Successful Outcome
A CPSO widget appears only when your org has workflow-outcome data to compute it from; it’s absent entirely otherwise, not shown empty.
All Agents
A sortable table — Agent, Runs, Success, Cost, Avg Cost/Run, Last Run — one row per agent in the current window. A row tagged “via parent traces” means its stats are attributed from a parent trace rather than its own direct runs; those rows are excluded from the header’s total-cost sum.
How to use it
- Switch the 7d / 30d / 90d window to re-scope the topology, fleet trend, CPSO, and table together.
- Click a column header to sort the table ascending or descending.
- Click any row to open that agent’s detail page.
- A declared (unconfirmed) topology node links to its agent detail page too, once it has an
agent_id— useful for jumping to a node discovery hasn’t confirmed yet.
Before you have data
Until an agent sends its first trace, the page shows an honest empty state instead of a blank table:
“No agents yet — Instrument your first agent with the Morse SDK and runs will appear here.”
To get your first agent here, follow the quickstart.
Related
- Agent detail — one agent’s traces, cost, and orchestration.
- Traces — the same runs, listed individually instead of rolled up.
- Context — fleet-wide context bloat and memory effectiveness.