Cost
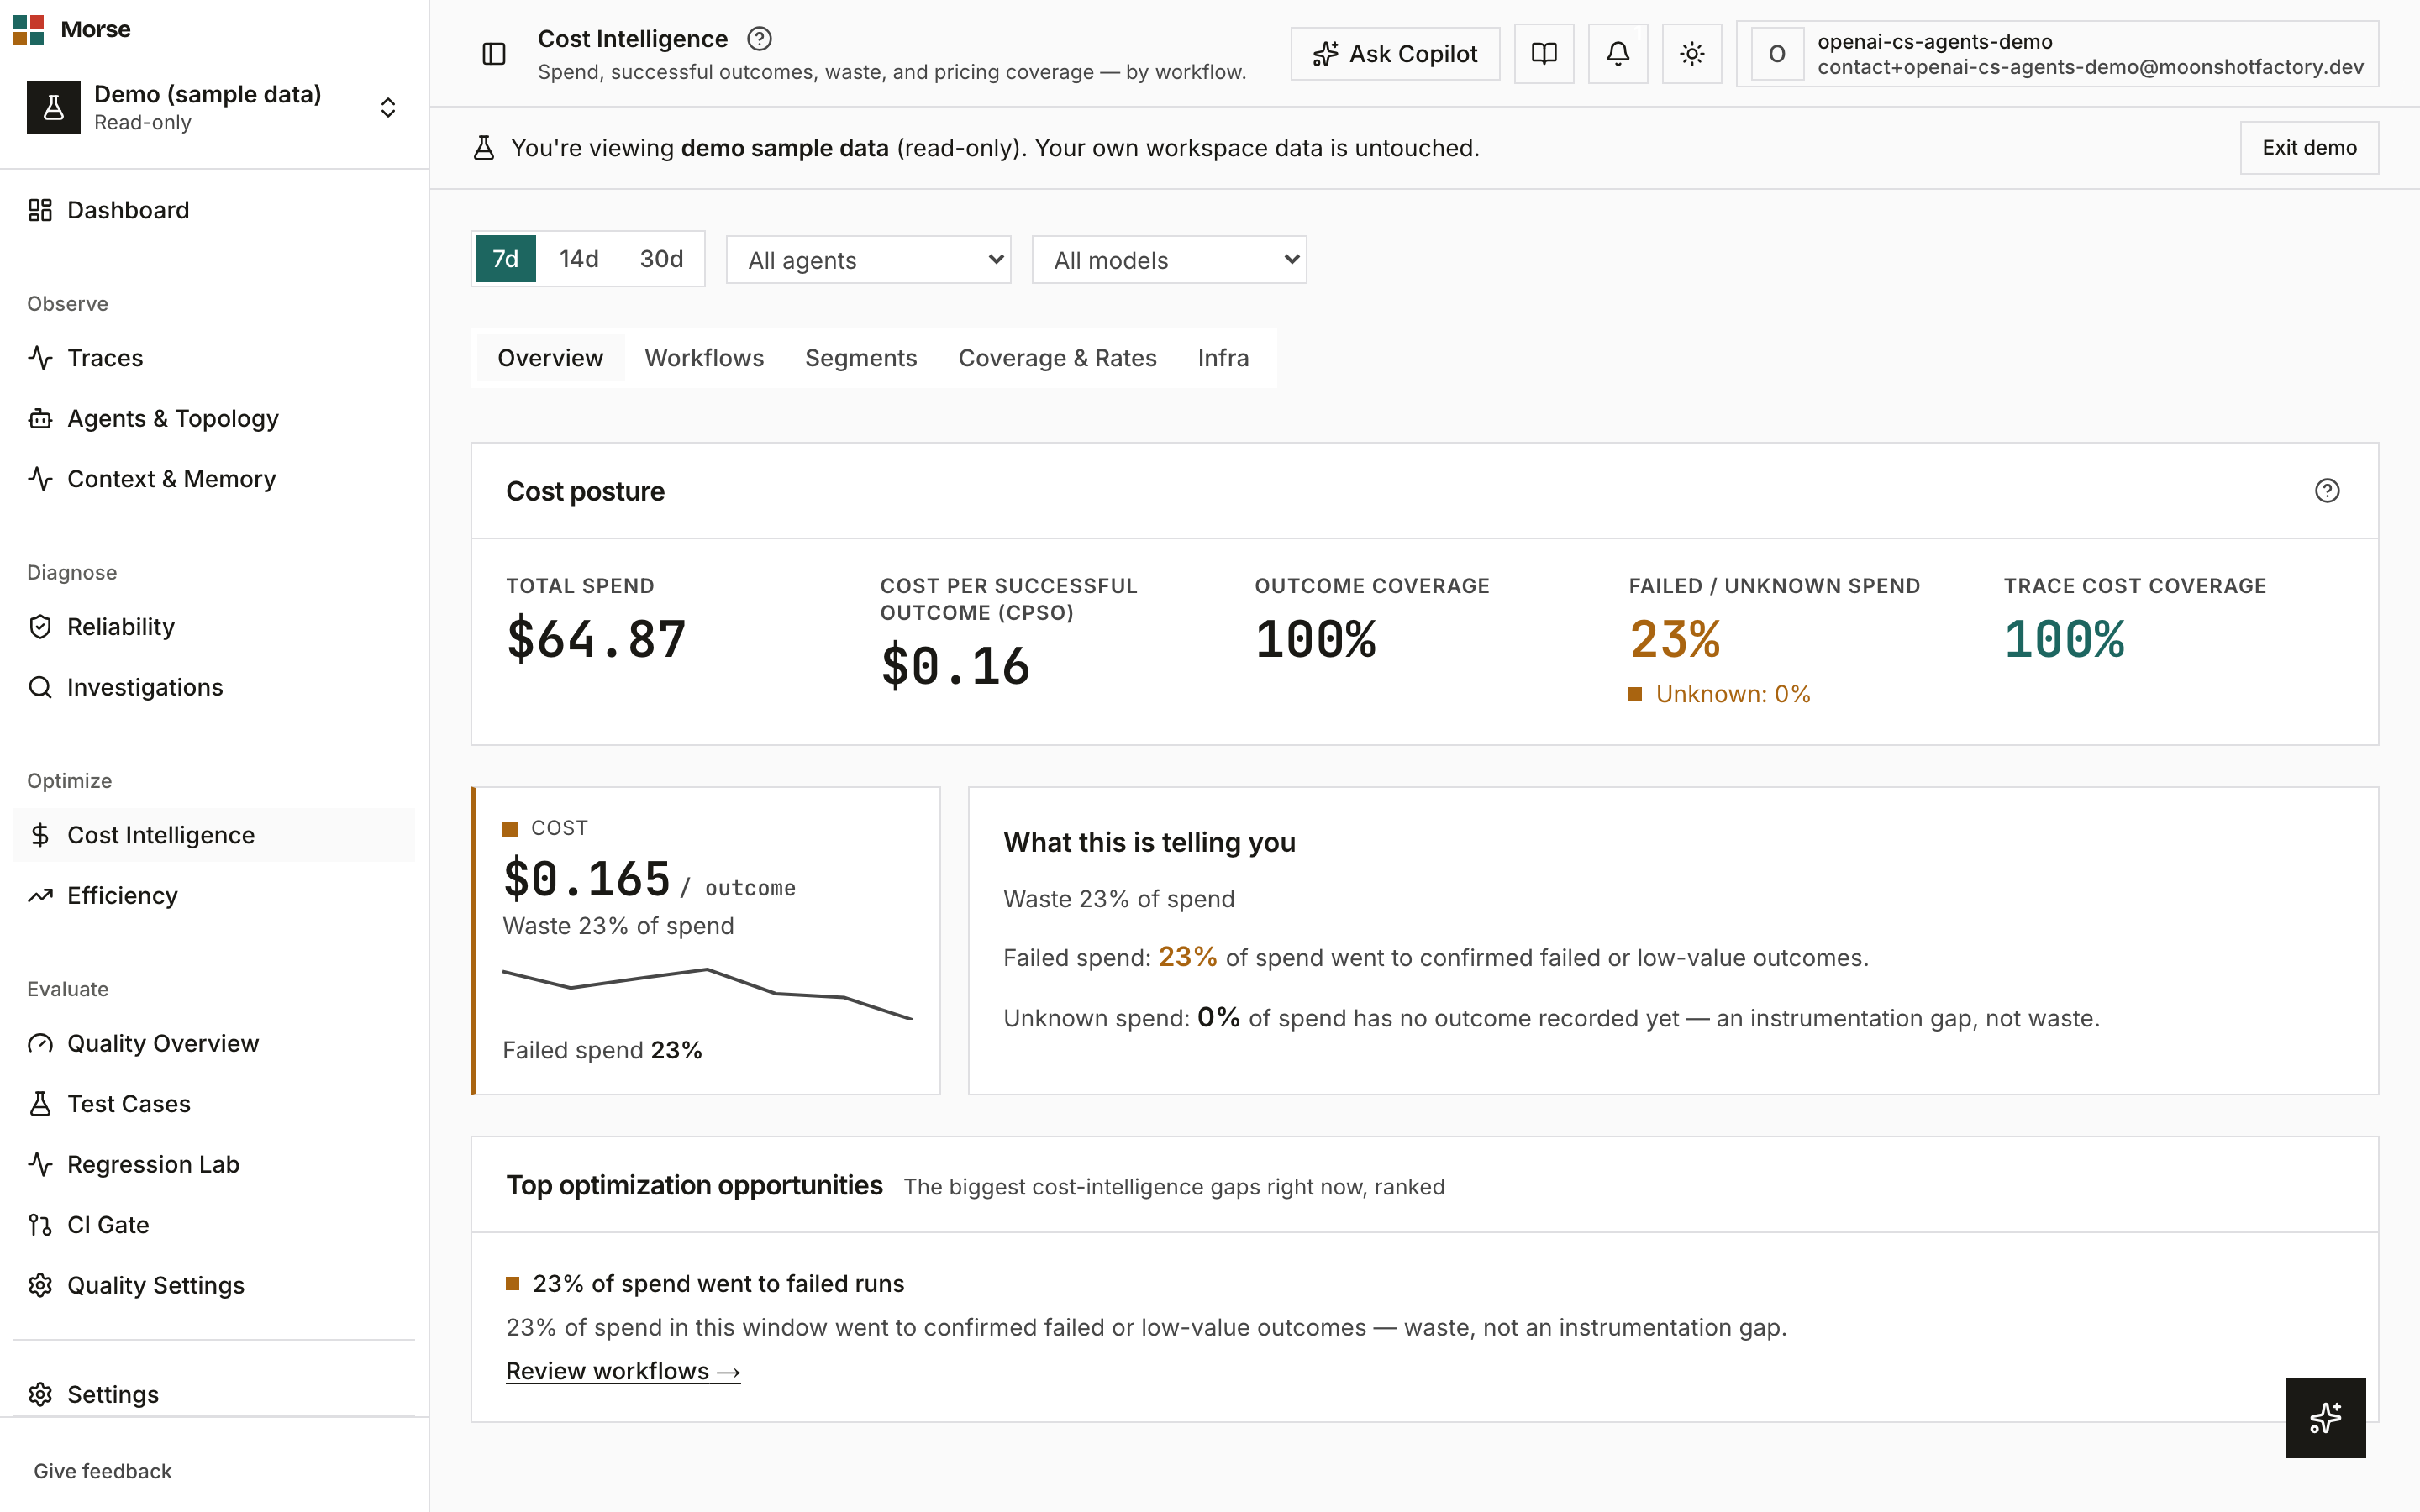
Most tools show you tokens burned. This screen shows you cost per successful outcome — what you actually spent to get a result your agent got right — with a trust score on every number so you know how much of it to take at face value.
What you see
/cost is a single route with five local tabs, switched with a ?tab= query param.
Overview
A “Cost posture” verdict strip — total spend, cost per successful outcome (CPSO), outcome coverage, failed/unknown spend, and trace cost coverage — followed by a plain-language “what this is telling you” panel and a ranked list of cost opportunities.
Workflows
Cost Per Successful Outcome (CPSO) by workflow: total cost divided by confirmed successful outcomes, not by run count. Traces with no recorded outcome are excluded from the denominator, so a workflow with nothing confirmed shows ”—” instead of a misleadingly low or zero figure.
An outcome-confirmation prompt sits above the widget for traces still waiting on a labeled result.
Segments
Cost by any custom dimension you already tag — customer, feature, team, plan — behind a pill-strip key selector and a breakdown table of cost, coverage, and trace count per value.
Segments are empty until your code calls set_context() once; the empty state prints the exact
line to add rather than hiding the capability.
Coverage & Rates
Two trust signals, kept on separate surfaces on purpose: catalog pricing coverage (the share of your org’s cost-bearing models with a known rate) and a pricing provenance panel showing which models are priced, where each rate came from, and how fresh it is.
Trace cost coverage vs. catalog pricing coverage
This tab’s catalog score is a different number from the “Trace cost coverage” stat on the Overview verdict strip — the Overview figure is how much of one trace’s LLM spend is priced; this tab’s figure is how much of your whole model catalog has a known rate. Neither is shown as a fabricated 0% when there is nothing to divide by — both resolve to an honest empty state instead.
Infra
Fleet infrastructure cost — an “Exact cloud bill” card when provider-billed data exists, successful/failed/idle spend split, a fleet CPSO stat, and a per-resource breakdown — with its own 24h/3d/7d window toggle.
How it prices spend
Every dollar in this screen is priced through one precedence chain: provider-reported pricing first, then a catalog rate (official, aggregator, or manual), and only when neither applies is a span unpriced.
Unpriced spans are excluded from totals, never averaged in at an assumed rate — this is enforced in the cost engine, not just a UI filter: estimated costs are walled out of both total spend and CPSO’s numerator by construction.
How to use it
- Switch tabs to move between the spend verdict, per-workflow CPSO, custom segments, trust signals, and infra.
- Filter by time window (7/14/30d), agent, or model — the filter bar applies across tabs.
- On Segments, pick a key to see cost, coverage, and trace count broken down by its values.
- On Coverage & Rates, check pricing provenance before trusting a number you’re about to budget against.
Before you have data
Missing or zero figures here mean “nothing measured,” never “nothing spent” — the screen never fabricates a cost from request counts times an assumed rate.
- No spend yet: totals, CPSO, and coverage scores render as ”—” rather than $0 or 0%.
- No outcomes confirmed for a workflow: its CPSO shows ”—”, not a misleadingly low cost.
- No custom metadata keys yet: Segments shows the
set_context()snippet instead of an empty table.