Context
This agent’s full context and memory picture: what its context budget is spent on, how it’s growing, whether prompt caching is saving money, and whether its memory store is actually helping. This is the deep-dive companion to the fleet-wide Context ranking — that page tells you which agent to look at; this tab is where you look.
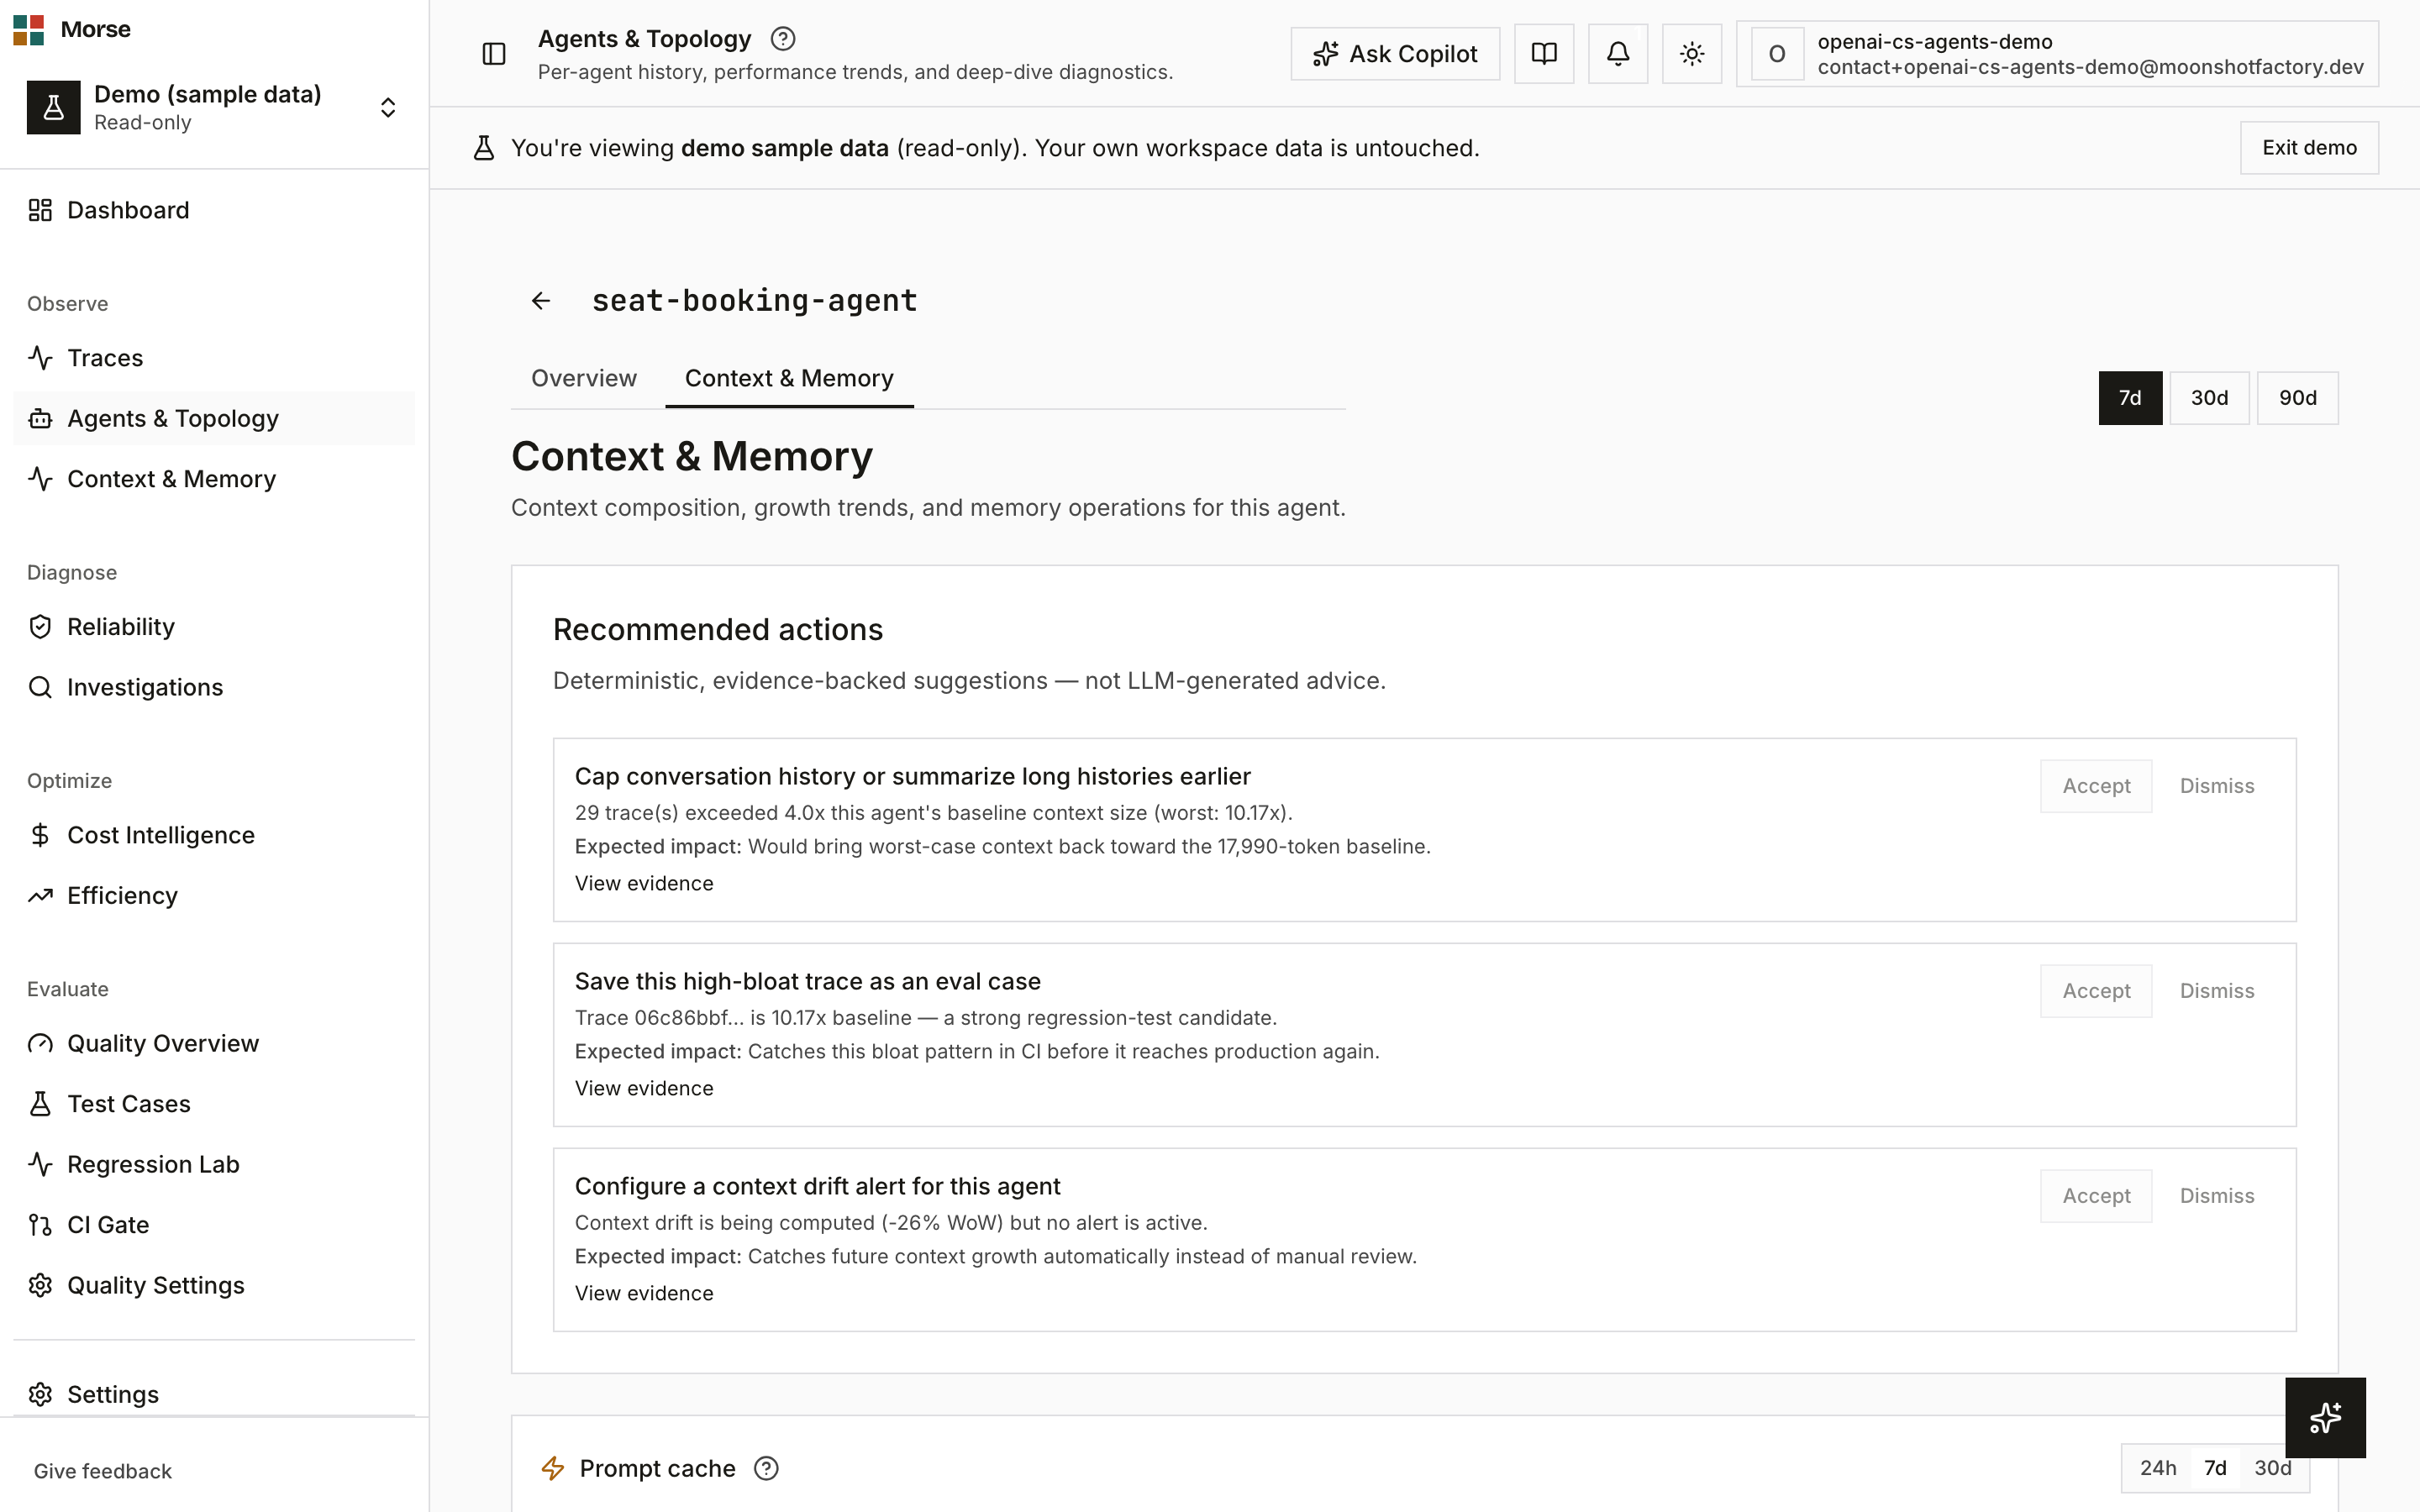
What you see
A 7d / 30d / 90d window switcher scopes the whole tab, carried in the URL and shared with the Overview tab so switching tabs doesn’t reset your range.
Recommended actions
Deterministic, evidence-linked fix suggestions for this agent. Accepting or dismissing one moves it to an “Accepted fixes” ledger; both actions are disabled (with a tooltip) in demo mode.
Prompt cache
Hit rate, savings, write cost, and an invalidation timeline. Cache economics differ sharply by provider — Anthropic reads cost 10% / writes cost 125%, OpenAI reads cost 50% / writes are free — and Morse applies the correct multiplier per model automatically, for both OpenAI and Anthropic spans, once cache tokens are present.
Agents on the Claude CLI subprocess adapter can’t expose cache control and show the cache empty state permanently — that’s an SDK-routing limit, not a pricing gap.
Context source breakdown
A proportional chart of where this agent’s context budget goes — system, history, tools, retrieval — shown only once source data exists.
Context Growth & Stability
A token-size-per-run area chart with a 4× baseline line; runs that spike past it are marked with red dots you can click to inspect the offending trace. Above a 60-day window the chart switches to day-bucketed (max-per-day) points and drops the per-run drift bar strip, since a run-over-run delta stops meaning much once a point represents multiple days.
Tool usage
Tools this agent has called, with defined-vs-called counts, call rate, and estimated monthly waste — when your SDK reports which tools were defined in the prompt, not just which were called. Stacks that only report calls lose those extra columns instead of showing fabricated numbers.
Memory operations
Ops/day, a memory-operations timeline, context churn, and an “Is memory helping?” cost/outcome comparison — but only for agents that have actually emitted a memory span. An agent with zero memory ops sees a quiet “This agent does not use external memory” card instead, not a section full of zeros.
The memory-on/off comparison itself needs 50+ traces per arm before it renders a verdict; below that it shows the trace counts and an insufficiency message rather than a comparison.
How to use it
- Switch the 7d / 30d / 90d window — it stays in sync with the Overview tab.
- Click a bloat-spike dot on the growth chart to inspect the offending trace.
- Toggle the growth chart between hourly and daily granularity.
- Accept or dismiss a recommended action to work through the fix list.
- Click a sample-trace link in any evidence section to open that trace.
Before you have data
Sections degrade individually rather than the whole tab going blank: no source data shows an empty state on that card; no memory spans replace the whole memory block with the explanatory card above; no tool-definition data drops the affected table columns.
Related
- Agent detail — this agent’s Overview tab (KPIs, orchestration, traces).
- Context — the fleet-wide ranking this tab is the drill-down for.