Efficiency
Efficiency is a ranked queue of the runs quietly costing you time and money — overcomplex runs doing more work than the task needed, the span adding the most latency to your slowest workflows, and dependency failures grouped by the external service actually causing them. Every entry links straight to the evidence (the actual traces) and a next action.
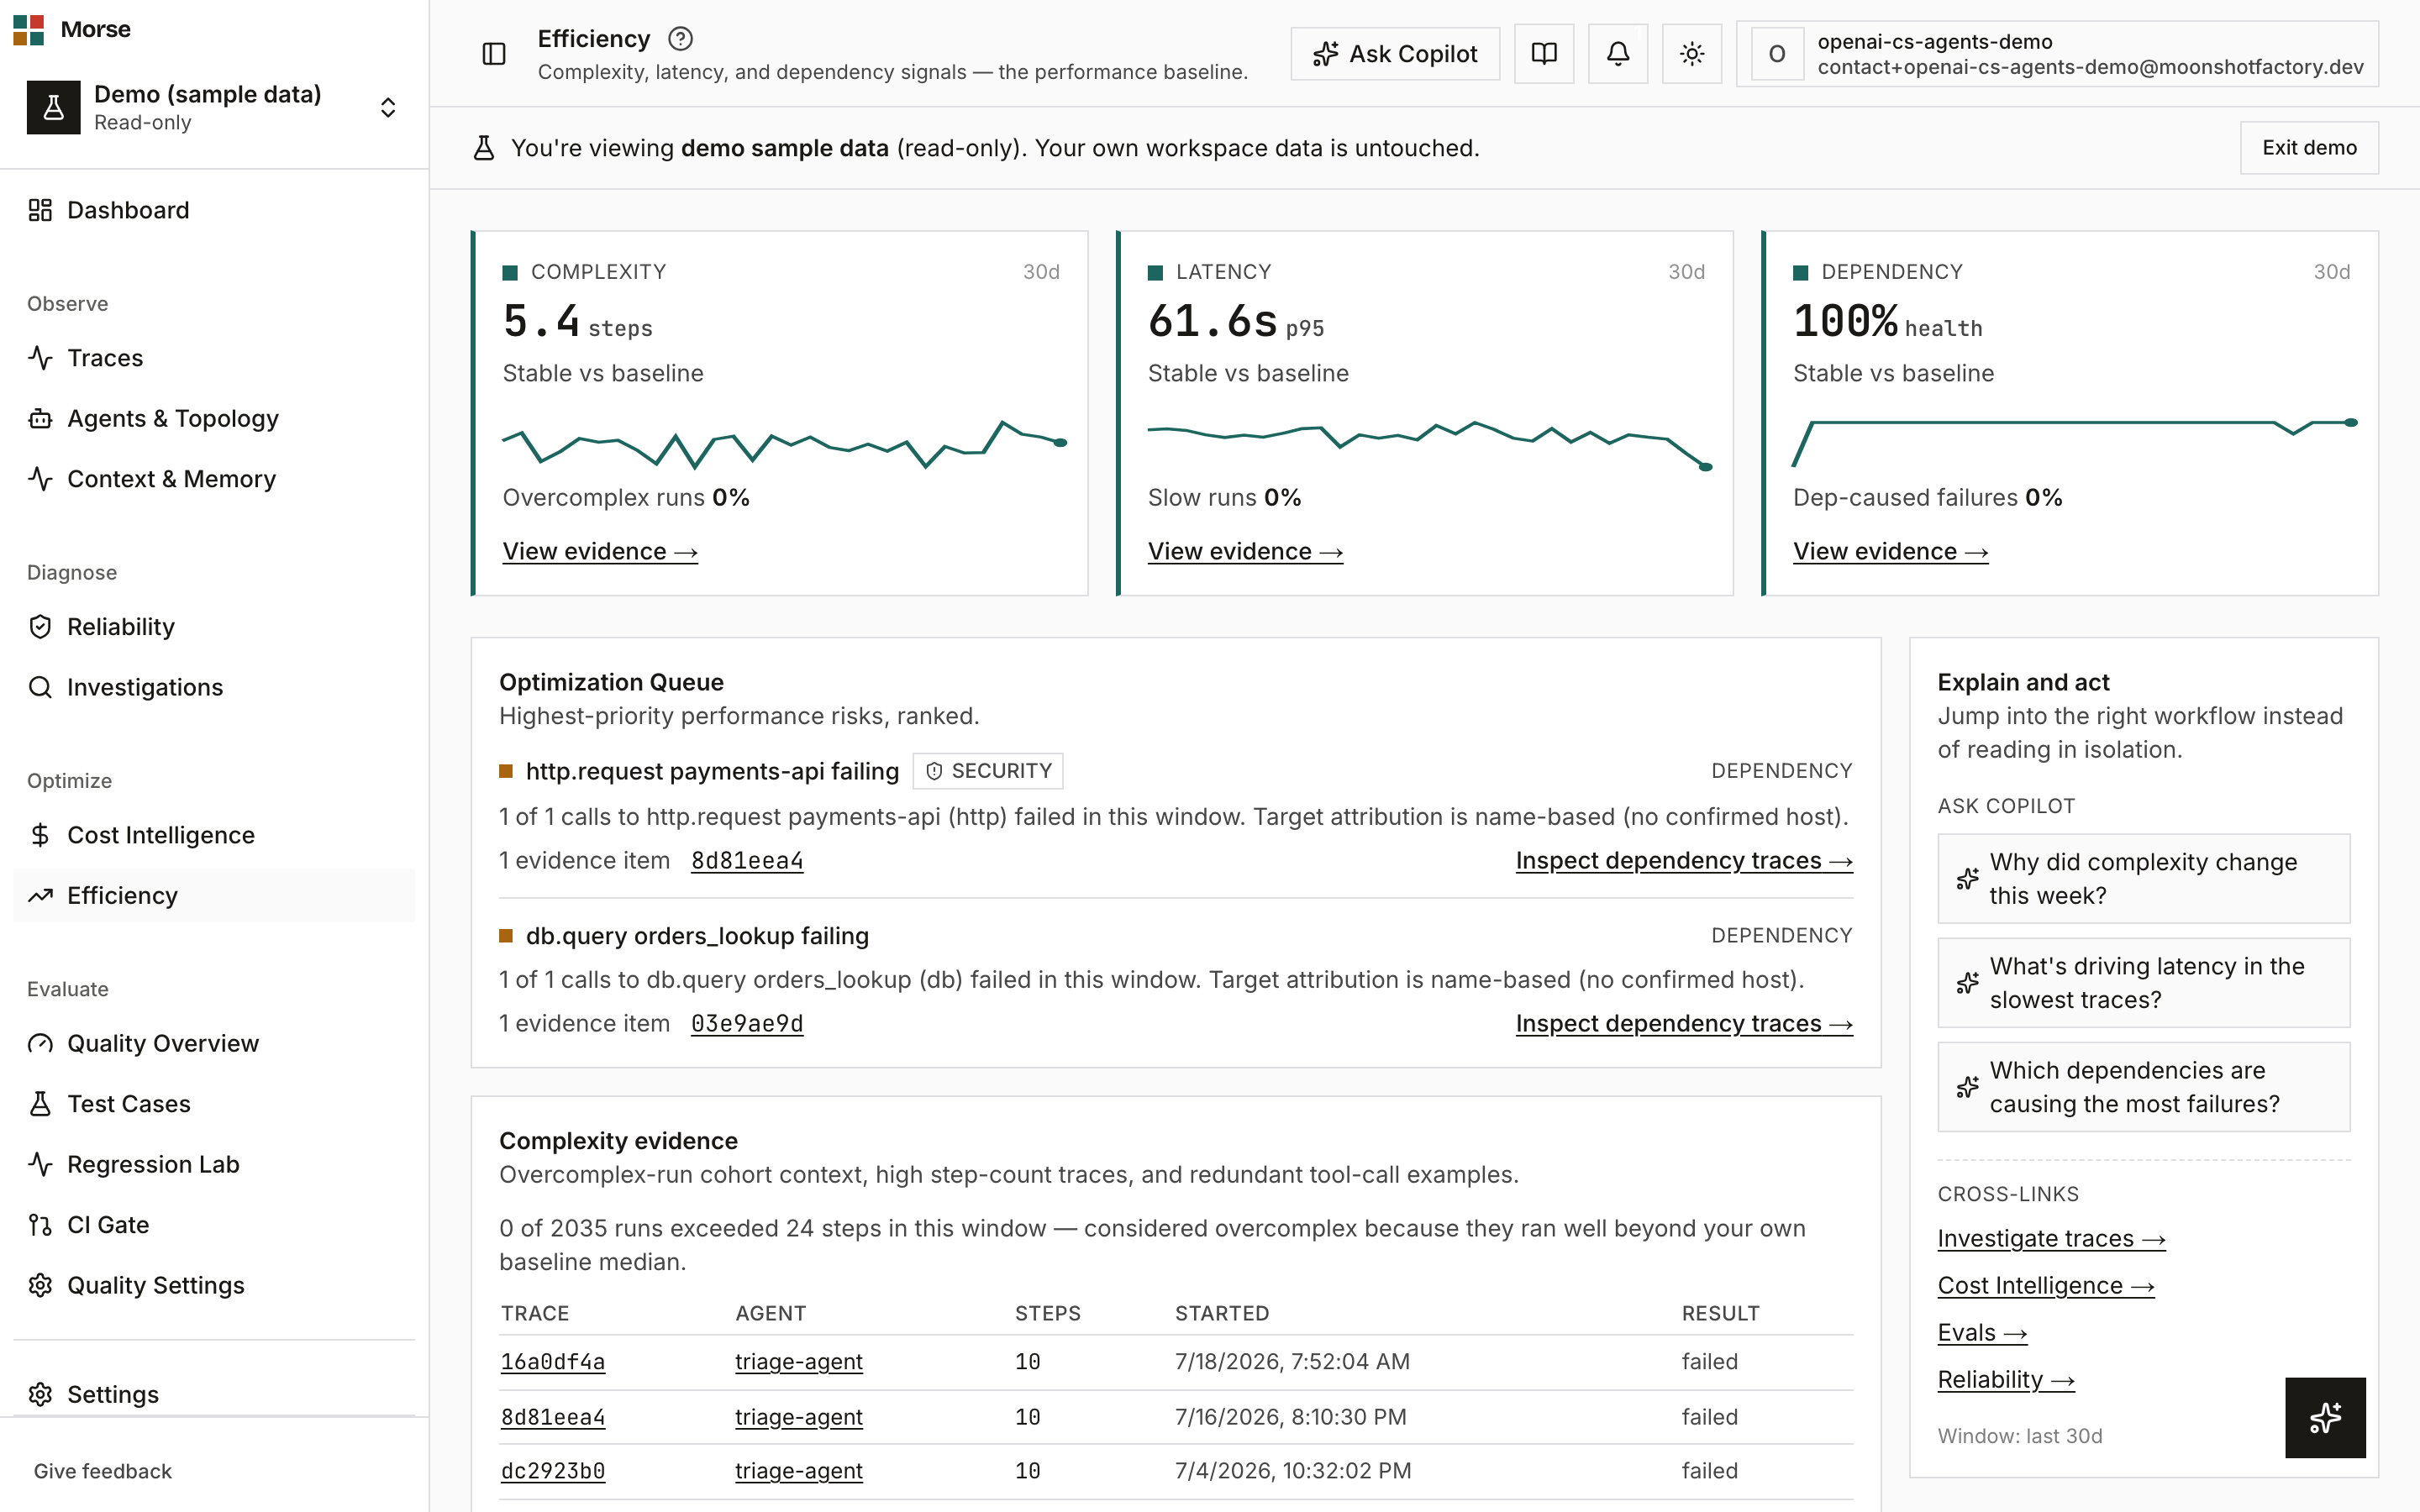
What you see
The Complexity, Latency, and Dependency panels render concurrently, not as tabs you switch between — every dimension is on the page at once.
A ?tab= query param only scrolls to and briefly highlights one panel for 2.5 seconds; it never
hides the others, and an unrecognized value falls back to no focus at all.
On mobile, the three dimensions collapse into a single-open accordion instead, with evidence rendered inline inside whichever item is open.
Summary panels
Each of the three summary panels — Complexity, Latency, Dependency — independently falls back to its own honest empty state if that one dimension lacks data, while the others keep showing what they have.
Optimization Queue
A single ranked worklist across all three dimensions: severity dot, title, reason, linked traces and agents, and a primary action link per item.
When nothing exceeds the current threshold, it says so explicitly and names which dimensions were checked rather than showing an empty list.
Evidence drilldowns
Below the queue, all three evidence sections stay visible together regardless of ?tab=: the
overcomplex-run trace table, latency’s largest-contributing-span breakdown, and dependency failures
grouped by target.
Dependency groups are keyed by span type and operation name, not a stable target host — because that field doesn’t exist on a span yet — so any group using that fallback carries an approximate badge and a note that better attribution requires more instrumentation.
Explain and act
An action rail with three Ask-Copilot prompt starters and cross-links — into Reliability (only when latency is amber/red), Security settings (only when a dependency reading is red), plus always-on links to Traces, Cost, Evals, and Reliability.
How to use it
- Start with the Optimization Queue — it’s the single triage surface across all three dimensions, before you read the individual panels.
- Use
?tab=links (or the panels’ own “View evidence” actions) to jump to and highlight one dimension without losing the others. - Follow evidence links straight into the underlying traces or agents.
- Use the action rail to ask Copilot about a dimension or jump into Reliability, Cost, or Evals for the same window.
Before you have data
Every empty state names a specific, honest reason instead of showing a zero or a blank chart: no data yet, baseline forming, stale computation being refreshed, older data removed by retention, or insufficient attribution for evidence that can’t be reliably derived yet.
If the whole workspace has no traces in the window, the page shows one page-level empty state above three “will populate once…” placeholders instead of three near-identical empty panels.
Related
- Traces — the evidence every Efficiency entry links back to.
- Reliability — where a latency risk becomes an SLO.
- Copilot — where the “Ask Copilot” prompt starters send their questions.