Regression
The Regression Lab — replay runs and compare two of them with real statistics, not an eyeballed score that moved. It merges the former Replay Runs and Run Comparison screens into one scrollable workspace.
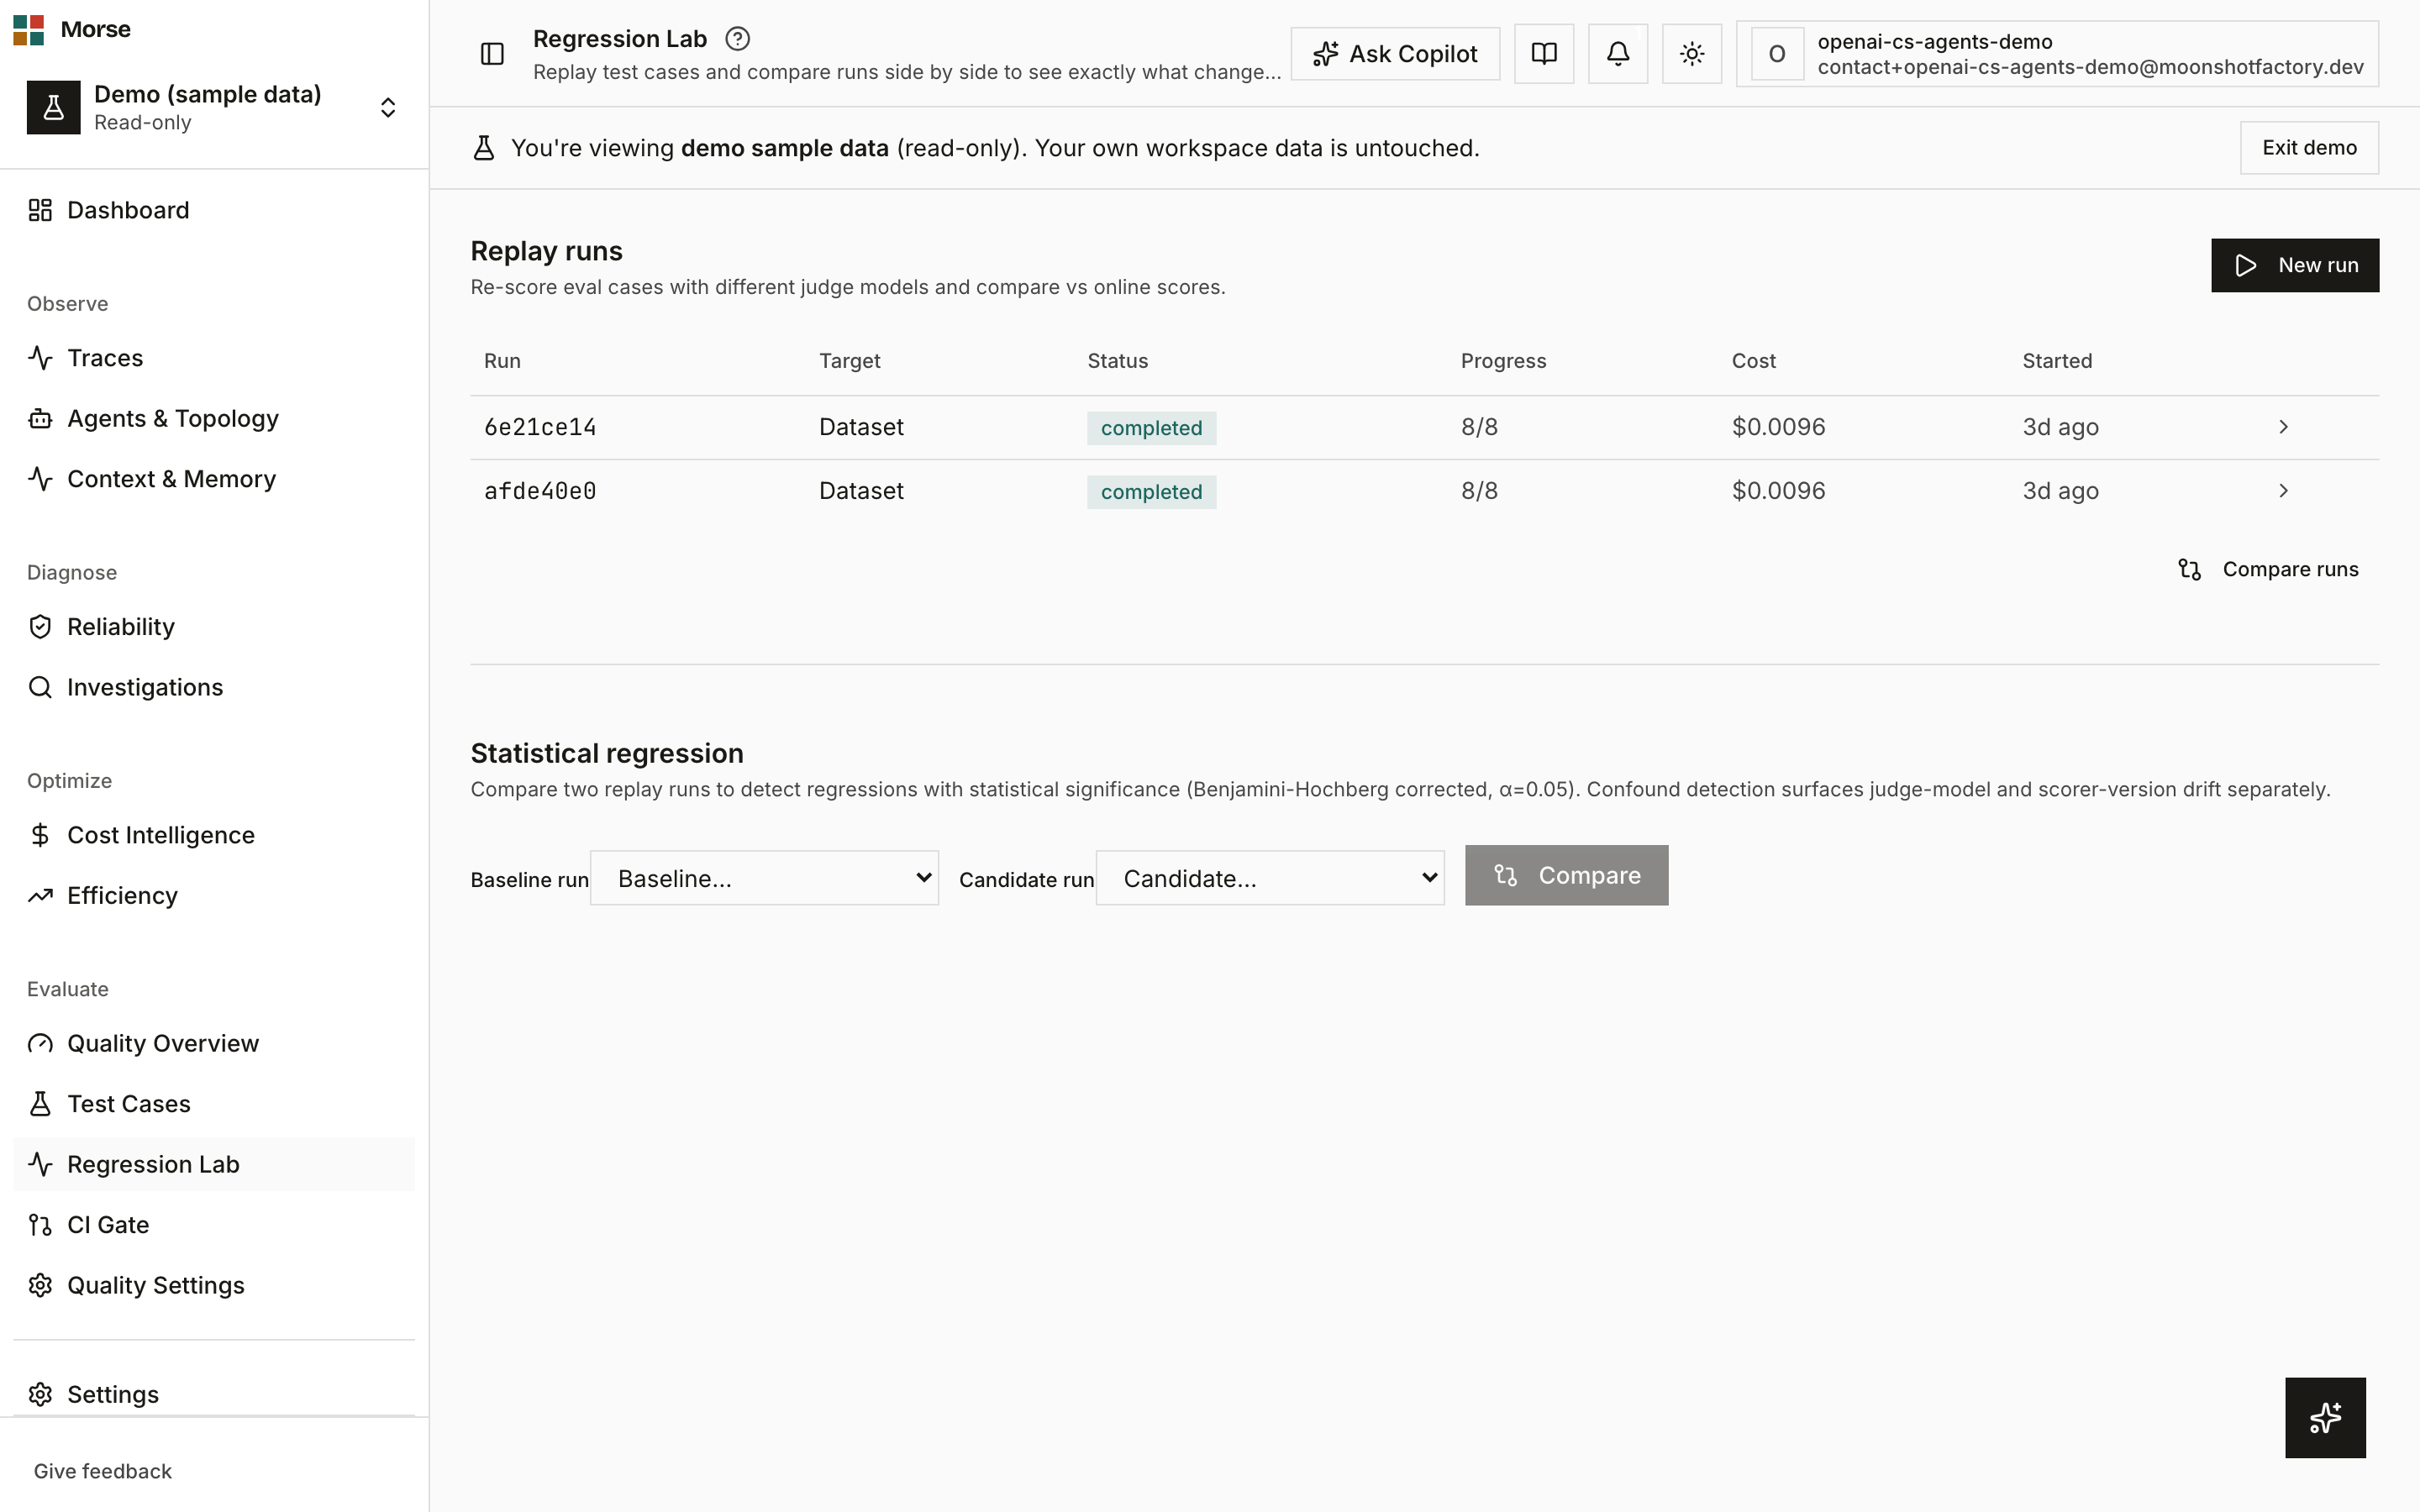
What you see
Two sections, joined by a “Compare runs” scroll-to button: Replay Runs on top, Statistical Regression below.
Arriving at /evals/regression?focus=runs or ?focus=compare highlights and auto-scrolls to the
relevant section.
Replay runs
A table of past runs — target (case or dataset), status, cases-completed progress, cost, and a deploy badge when a run started within two hours of a detected deploy.
New run opens a dialog to replay a whole dataset or a single case against the current scorer suite; results are isolated from the online scores you already have.
Clicking a row opens a detail drawer with per-scorer results; single-case runs get a second tab, Diff vs online, comparing the replay score to the live online score.
Replay re-scores a frozen input/output snapshot with the current scorer suite — it does not re-run your agent. Trajectory, tool-validity, faithfulness, and instruction-following scorers require re-execution, which is called out in the trigger dialog as “coming later.”
Statistical regression
Pick a baseline run and a candidate run from two dropdowns (only completed/partial runs are selectable) and click Compare.
The result table shows, per scorer: sample size (N), baseline stat, candidate stat, delta, the Benjamini-Hochberg-adjusted p-value, and a verdict — improved, regressed, no change, inconclusive, or confounded.
A readiness banner above this section states plainly when there aren’t yet two comparable runs, so you see that before opening the picker.
Binary pass/fail scores are compared with a two-proportion z-test; continuous 0–1 scores use a bootstrap 95% confidence interval (1,000 resamples) instead, since a bounded [0,1] distribution with mass at 1.0 violates the normality assumption a t-test needs.
Every scorer’s p-value in one comparison is corrected together with Benjamini-Hochberg false-discovery correction at α=0.05, so testing many scorers at once doesn’t inflate false positives.
A scorer needs at least 20 cases (MIN_N) before its comparison returns anything but
inconclusive. Below that, the result is labeled directional-only, not hidden — the UI names how
many more cases you need.
Judge-model drift (different judge model between the two runs) and scorer-version drift surface as separate confound flags on the affected scorer row, rather than being folded into the delta.
How to use it
- Trigger a replay against a dataset (or a single case) to establish a run you can later compare.
- Use the Diff-vs-online tab on a single-case run to see exactly how a replay score differs from what’s live.
- Once you have two completed/partial runs, pick them as baseline and candidate and compare — read the verdict per scorer, not just the headline delta, and check for confound flags before trusting a “regressed” call.
- If a scorer reads inconclusive, add more cases from Cases rather than trusting a small-N delta.
Before you have data
With no replay runs yet, the Replay Runs table reads “No replay runs yet” with a Trigger your first replay button.
With fewer than two comparable runs, the comparison section shows a dashed banner explaining exactly how many more runs are needed, instead of an empty picker.