Context
The fleet-wide context and memory picture: which agents are bloating their context windows, wasting tokens on unused tools, or paying for memory that isn’t helping. This is a fixed 30-day (and 7-day sparkline) ranking view with no time-range control of its own — open an agent’s own Context & Memory tab for the deep charts, prompt-cache panel, and memory-operations detail this page doesn’t carry.
What you see
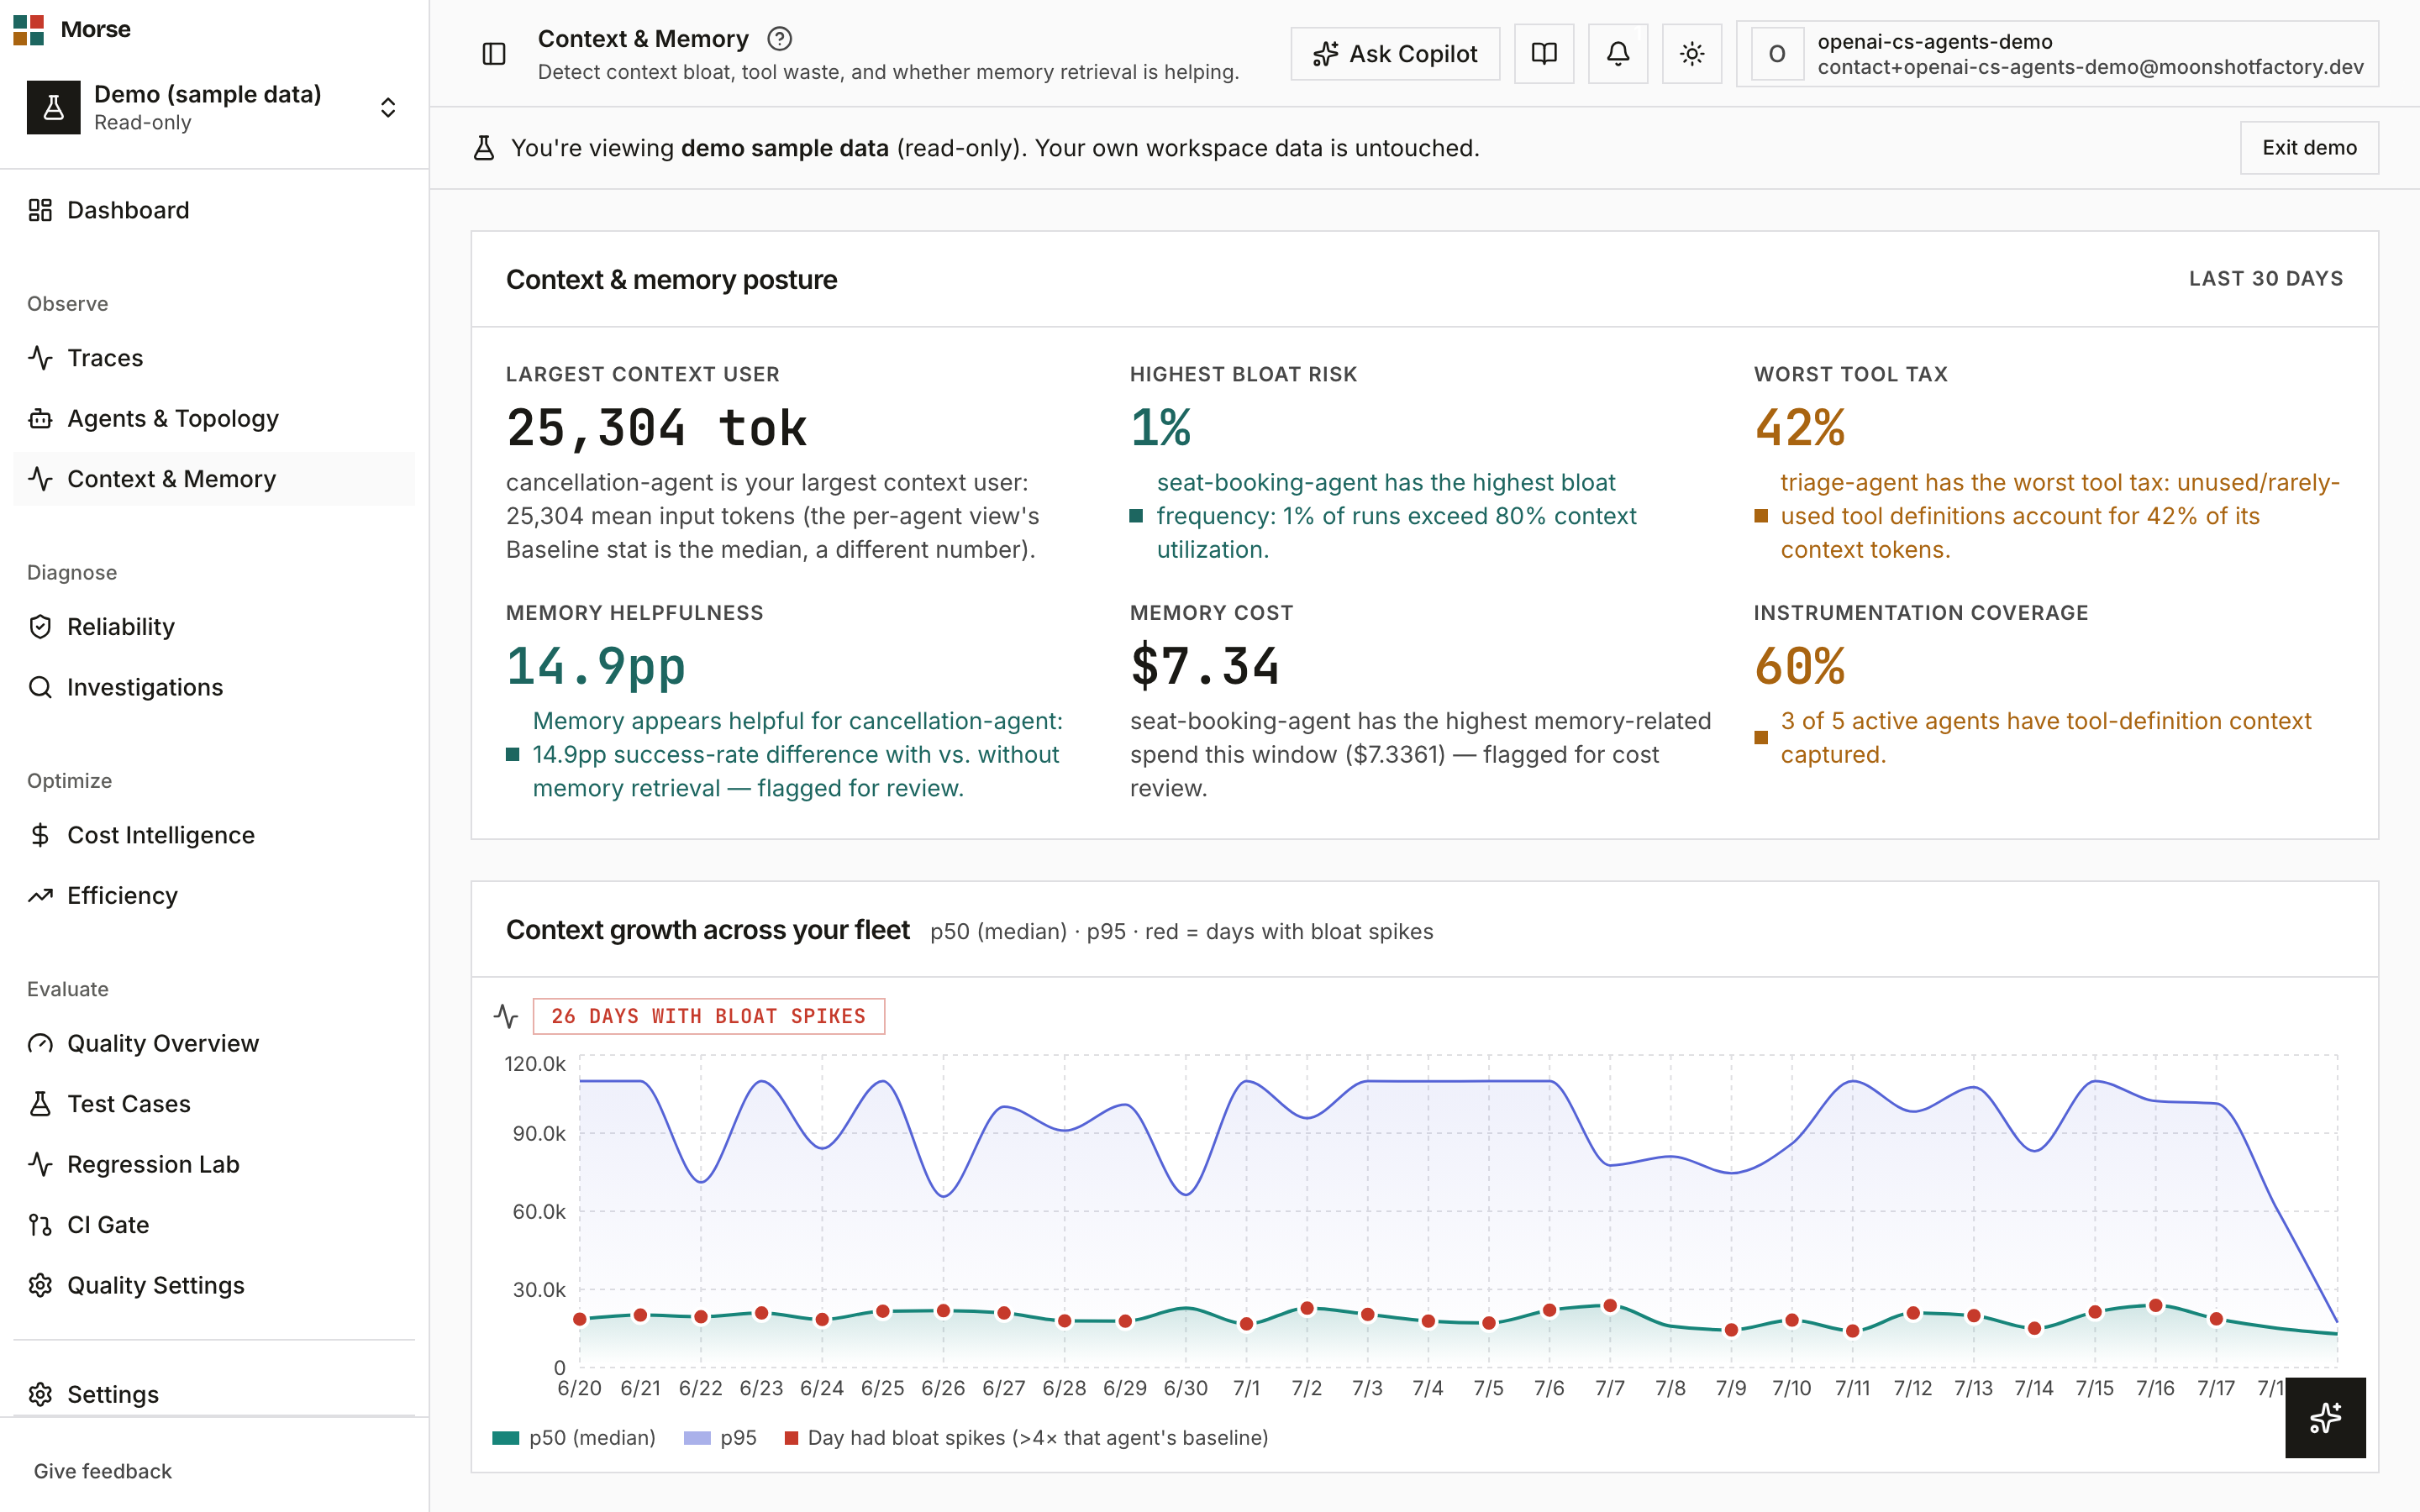
Context & memory posture
Six earned-severity cards: Highest Bloat Risk, Worst Tool Tax, Instrumentation Coverage, Largest Context User, Memory Cost, and Memory Helpfulness. A card is only colored (teal/amber/red) when its number is inherently good or bad — Largest Context User and Memory Cost just name the biggest number, so they stay uncolored. Cards without confident data move into a separate “Instrumentation gaps” list instead of showing a colored zero.
Fleet context growth and composition
A daily p50/p95 area chart of context growth across the fleet, followed by a composition trend chart.
Agent ranking
One row per agent: avg tokens, tool waste %, bloat frequency %, a 7-day sparkline, avg cost, and an efficiency score. Sortable by avg tokens or efficiency score.
Three metrics that look similar but aren’t: bloat frequency is the % of runs with utilization above 80% of the context window; tool waste is tool-definition tokens ÷ total context tokens; efficiency is utilization × (1 − tool waste). A cell shows a reasoned dash (hover for why) when a metric can’t be computed instead of a fabricated number — e.g. tool waste with no tool-definition data, or efficiency with no LLM utilization recorded.
Trace evidence
Seven categories of drill-down trace links backing the table’s numbers: highest context runs, worst bloat examples, low-relevance memory retrievals, high-cost memory runs, traces where memory helped or may have hurt, and traces with unused tool tax.
How to use it
- Sort the ranking table by avg tokens or efficiency score.
- Click any ranking row to open that agent’s Context & Memory tab,
carrying a
?from=context-intelligencebreadcrumb back to this page. - Hover a column header’s ⓘ icon for its exact definition.
- Expand a trace-evidence category to see the runs backing it, and click one to open its trace.
Before you have data
If no agent has context data for the past 30 days, the ranking table shows: “No context data for the past 30 days. Agents appear here once they have traces with LLM spans. If you have recent traces, make sure you’re logged in as the account that owns them.”
Related
- Agents context tab — this page’s per-agent drill-down.
- Agents — the fleet view for health and cost instead of context.