Detail
One agent, over time: its KPIs, orchestration breakdown, trend charts, and every trace it produced. Open this from the Agents list when you want to zoom into a single agent instead of scanning the fleet.
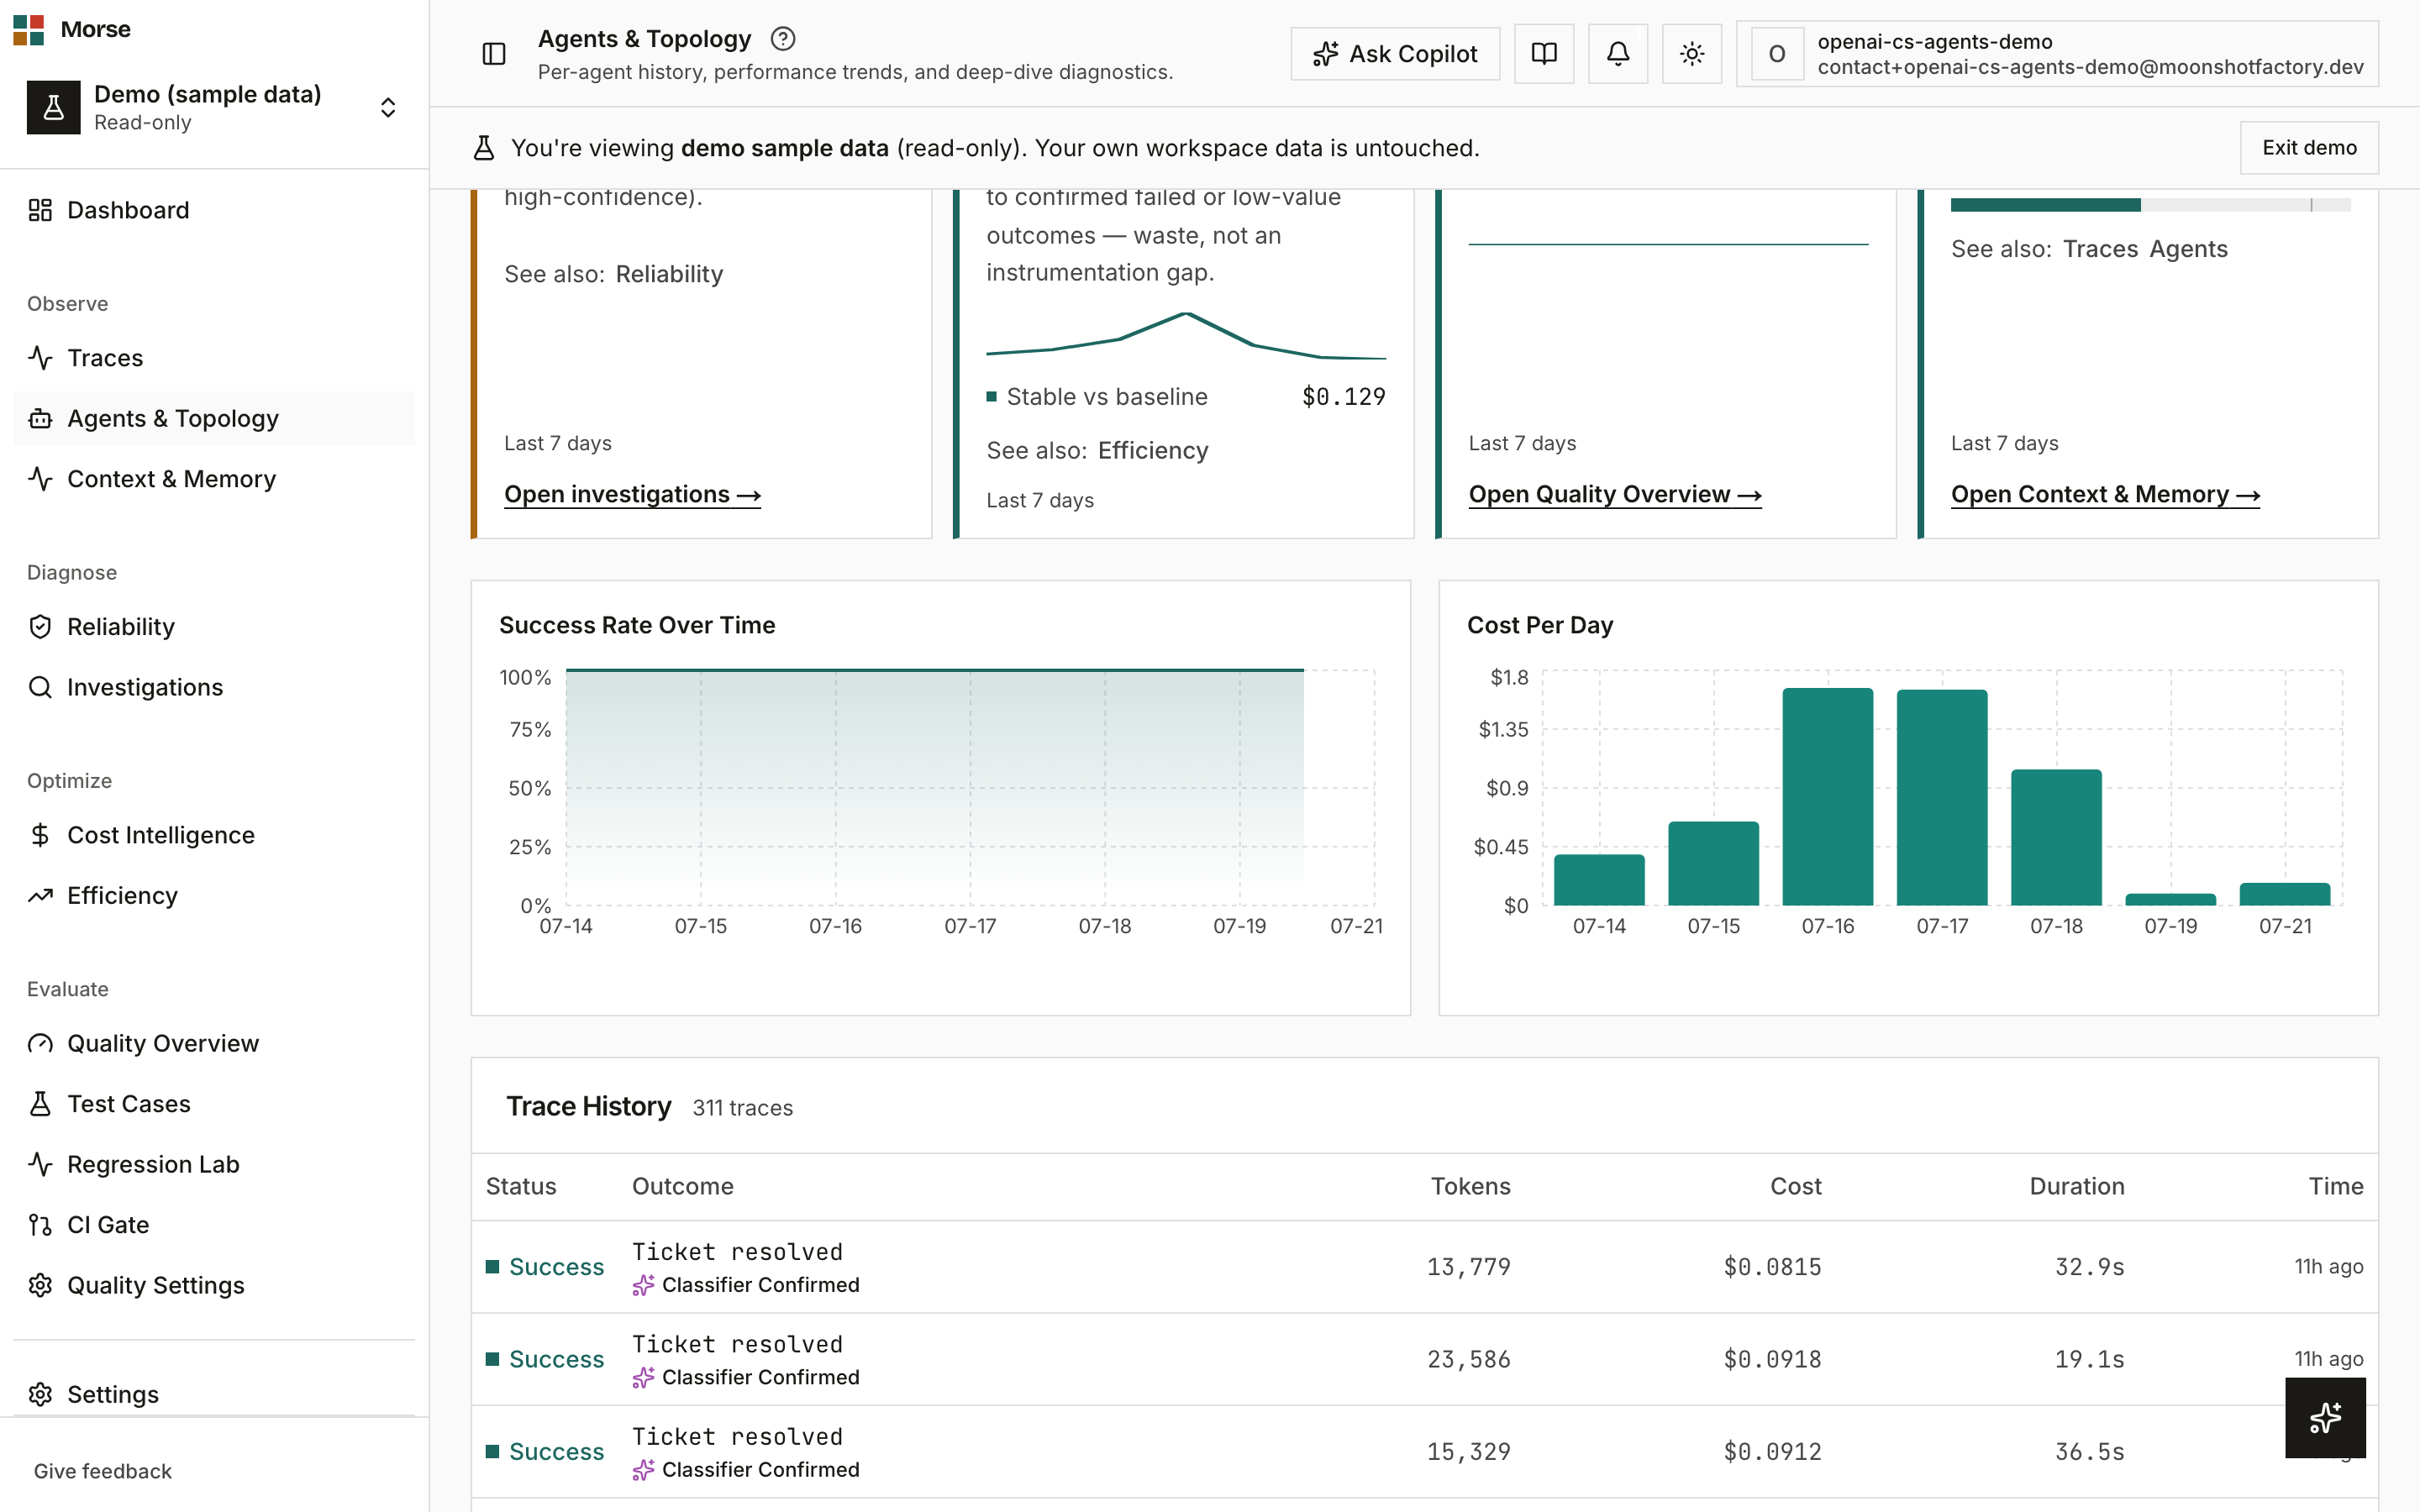
What you see
A header with the agent’s name, a status badge, and a node-type badge (orchestrator / specialist / standalone), plus a date-range selector and a tab bar.
Overview and Context & Memory tabs
Overview (this page) and Context & Memory share one time window, carried via the URL’s
?window= param — switching tabs never resets your date range.
The date-range control offers 1h / 6h / 24h / 7d / 30d / 90d here; the Context & Memory tab only supports 7d / 30d / 90d, so a finer selection collapses to 7d when you switch tabs.
KPI cards
Five cards: Total Traces, Success Rate (with a trend delta against the prior window), Total Cost, Avg Cost/Run, and Last Run.
Orchestration and Operating Summary
An orchestration breakdown panel, followed by the same 4-card Cost / Quality / Reliability /
Context & Memory Operating Summary strip used elsewhere in the product, scoped to this agent via
agent_id.
Trend charts
Success Rate Over Time and Cost Per Day (or Per Hour, on an hourly range), both scoped to the selected date range.
Trace History
A paginated table of this agent’s runs — Status, Outcome, Tokens, Cost, Duration, Time — 50 at a time, loaded incrementally.
If you arrived here from an alert, a dismissible banner names the alert instead of scrolling to or highlighting anything — this page has no inline alerts section to scroll to.
How to use it
- Pick a date range to re-scope the KPIs, charts, and orchestration panel.
- Click Context & Memory to switch to this agent’s context tab, carrying the same window.
- Click any trace row to open its full trace; the trace’s Back button returns you here instead of the generic traces list.
- Click Load more to page through additional trace history.
Before you have data
Until this agent has runs in the selected window, the Trace History table shows “No traces recorded yet” instead of an empty grid.
Related
- Agents — the fleet view this page drills down from.
- Context — this agent’s context makeup and memory effectiveness.
- Trace detail — dissect any one of this agent’s runs.