Reliability
Alerts, SLOs, and incidents used to be three disconnected screens you had to correlate yourself. Reliability puts them behind one URL — a posture strip up top, three tabs below — so an SLO shows you the alert watching it, and an incident links back to whatever actually triggered it.
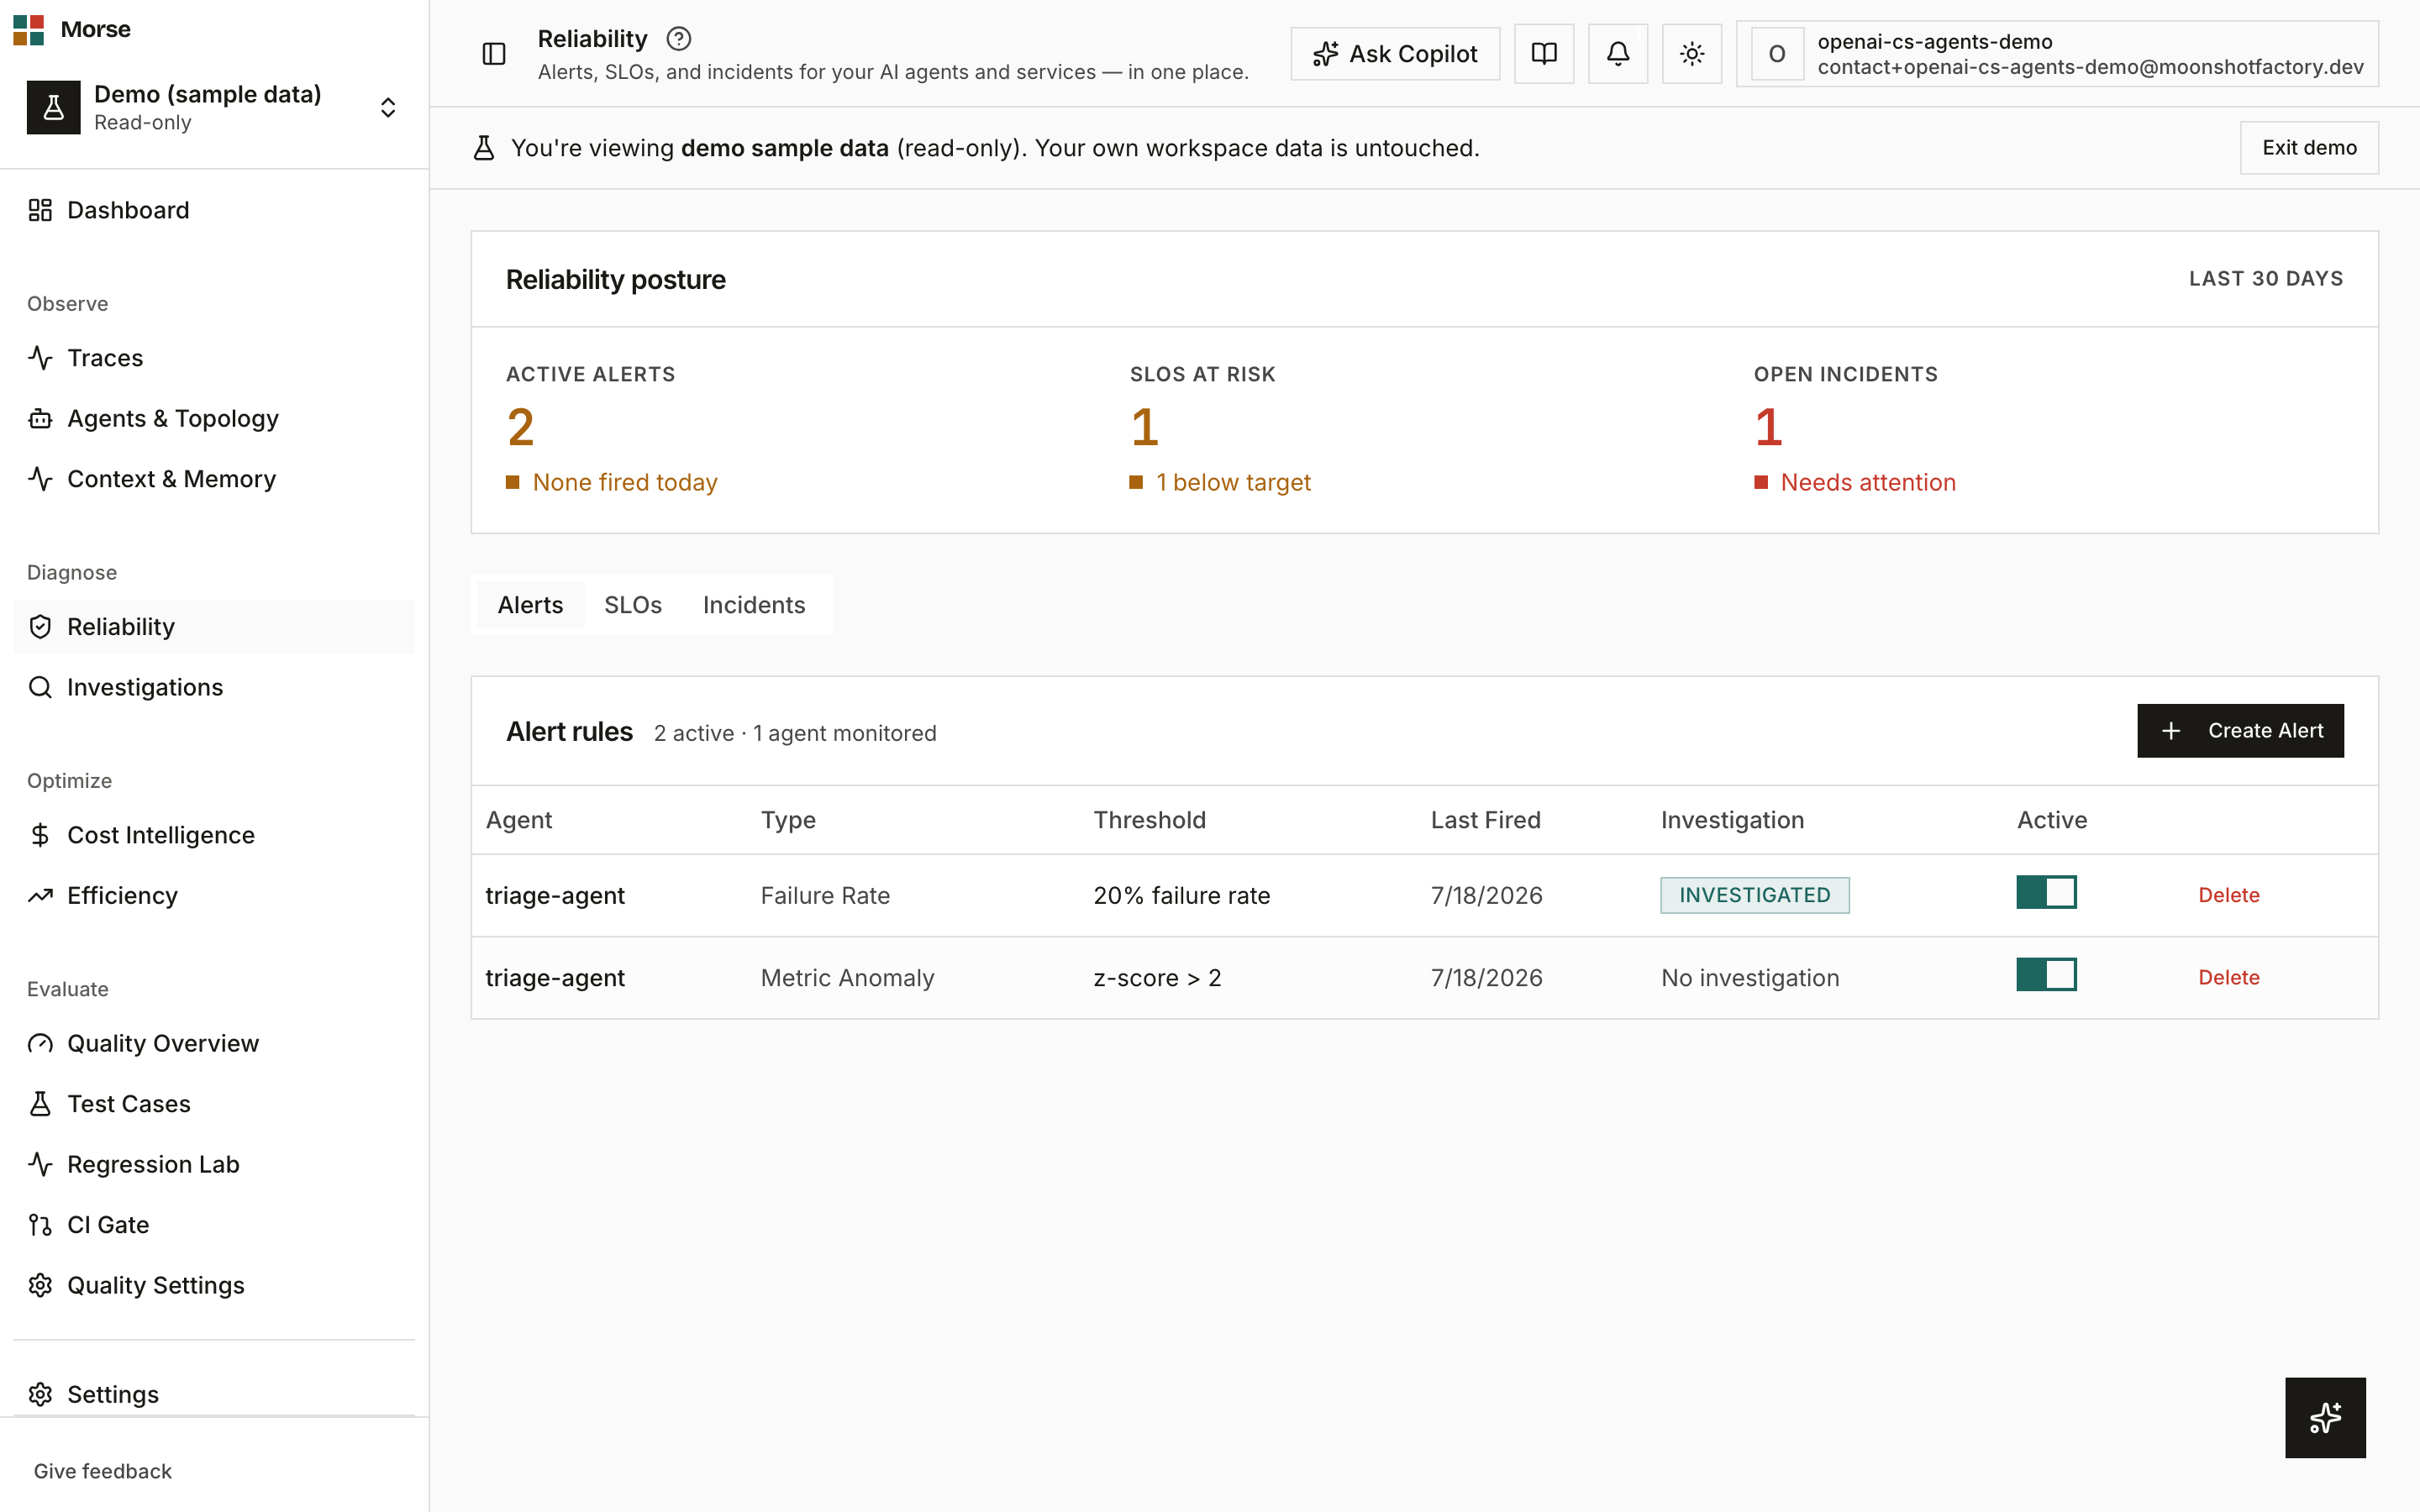
What you see
The page is client-rendered and always fetches fresh (force-dynamic) — nothing here is cached
across navigations.
Reliability posture
A strip of three stat blocks above the tabs: Active alerts, SLOs at risk, and Open incidents, each colored teal when clear and amber/red when not. Clicking a block switches to that block’s tab.
Active-alert and open-incident counts come from a single GET /reliability/posture call; SLOs at
risk is derived client-side from the SLOs list, counting an SLO only when it has a real
value (not “insufficient data”) and its status is not met.
Alerts
A table of alert rules — agent, type, threshold, last fired, an Investigator status badge, an active toggle, and delete — plus a Create Alert dialog.
Nine alert types are available: failure rate, inactivity, cost threshold, latency threshold, eval score, cost per run, daily spend, SLO burn rate, and metric anomaly — the create form’s fields (threshold label, extra config) change per type.
Clicking an agent name opens that alert’s detail page.
SLOs
A card grid, one card per SLO, each showing the target, the current value, an error-budget progress bar, a met/breached icon, and — if a burn-rate alert is attached to it — a link to that alert.
Target types are success rate, latency P95/P99, availability, cost per run, or a custom metric. The window is a preset dropdown — 7, 14, 30, or 90 days — not free text.
An Evaluate button re-runs all SLO evaluations on demand, and New SLO opens the create form, which can define a brand-new custom metric inline without leaving the flow.
The 7/14/30/90-day preset is a UI convention, not a server-side constraint — the API’s
window_days field takes any integer, so a caller hitting the endpoint directly (not through
this form) isn’t limited to the four presets.
Incidents
A filterable (all / open / investigating / resolved) list of incident rows, each with a severity badge, a status badge, and a relative timestamp; a New Incident button opens an inline create form.
Clicking a row opens that incident’s timeline.
How to use it
- Scan the posture strip first — it tells you which of the three tabs, if any, needs attention.
- Switch tabs to work the specific surface: create or toggle an alert, define an SLO (and its custom metric, if needed), or file and filter incidents.
- Follow a burn-rate-alert link from an SLO card, or an alert link from an incident’s timeline entry, to move between the three without losing context.
- Each tab’s empty state cross-links to the other two, so picking the wrong tab for what you’re trying to do isn’t a dead end.
Burn rate is Google’s SRE-workbook single-window formula — current_error_rate / error_budget — evaluated once per SLO per check, not the dual-window (fast+slow) technique.
Before you have data
- No alerts configured: “No alerts configured”, with a prompt pointing to SLOs and Incidents.
- No SLOs configured: “No SLOs configured yet. Create one to start tracking reliability.”
- No incidents recorded: “No incidents recorded” (or “No incidents match this filter” when a status filter is active), with a prompt pointing to Alerts and SLOs.
To get your first alert or SLO here, follow the quickstart.