Copilot
Ask Morse is a chat panel available from every dashboard page — open it to ask about your own agents in plain English instead of building a filter or reading a chart yourself.
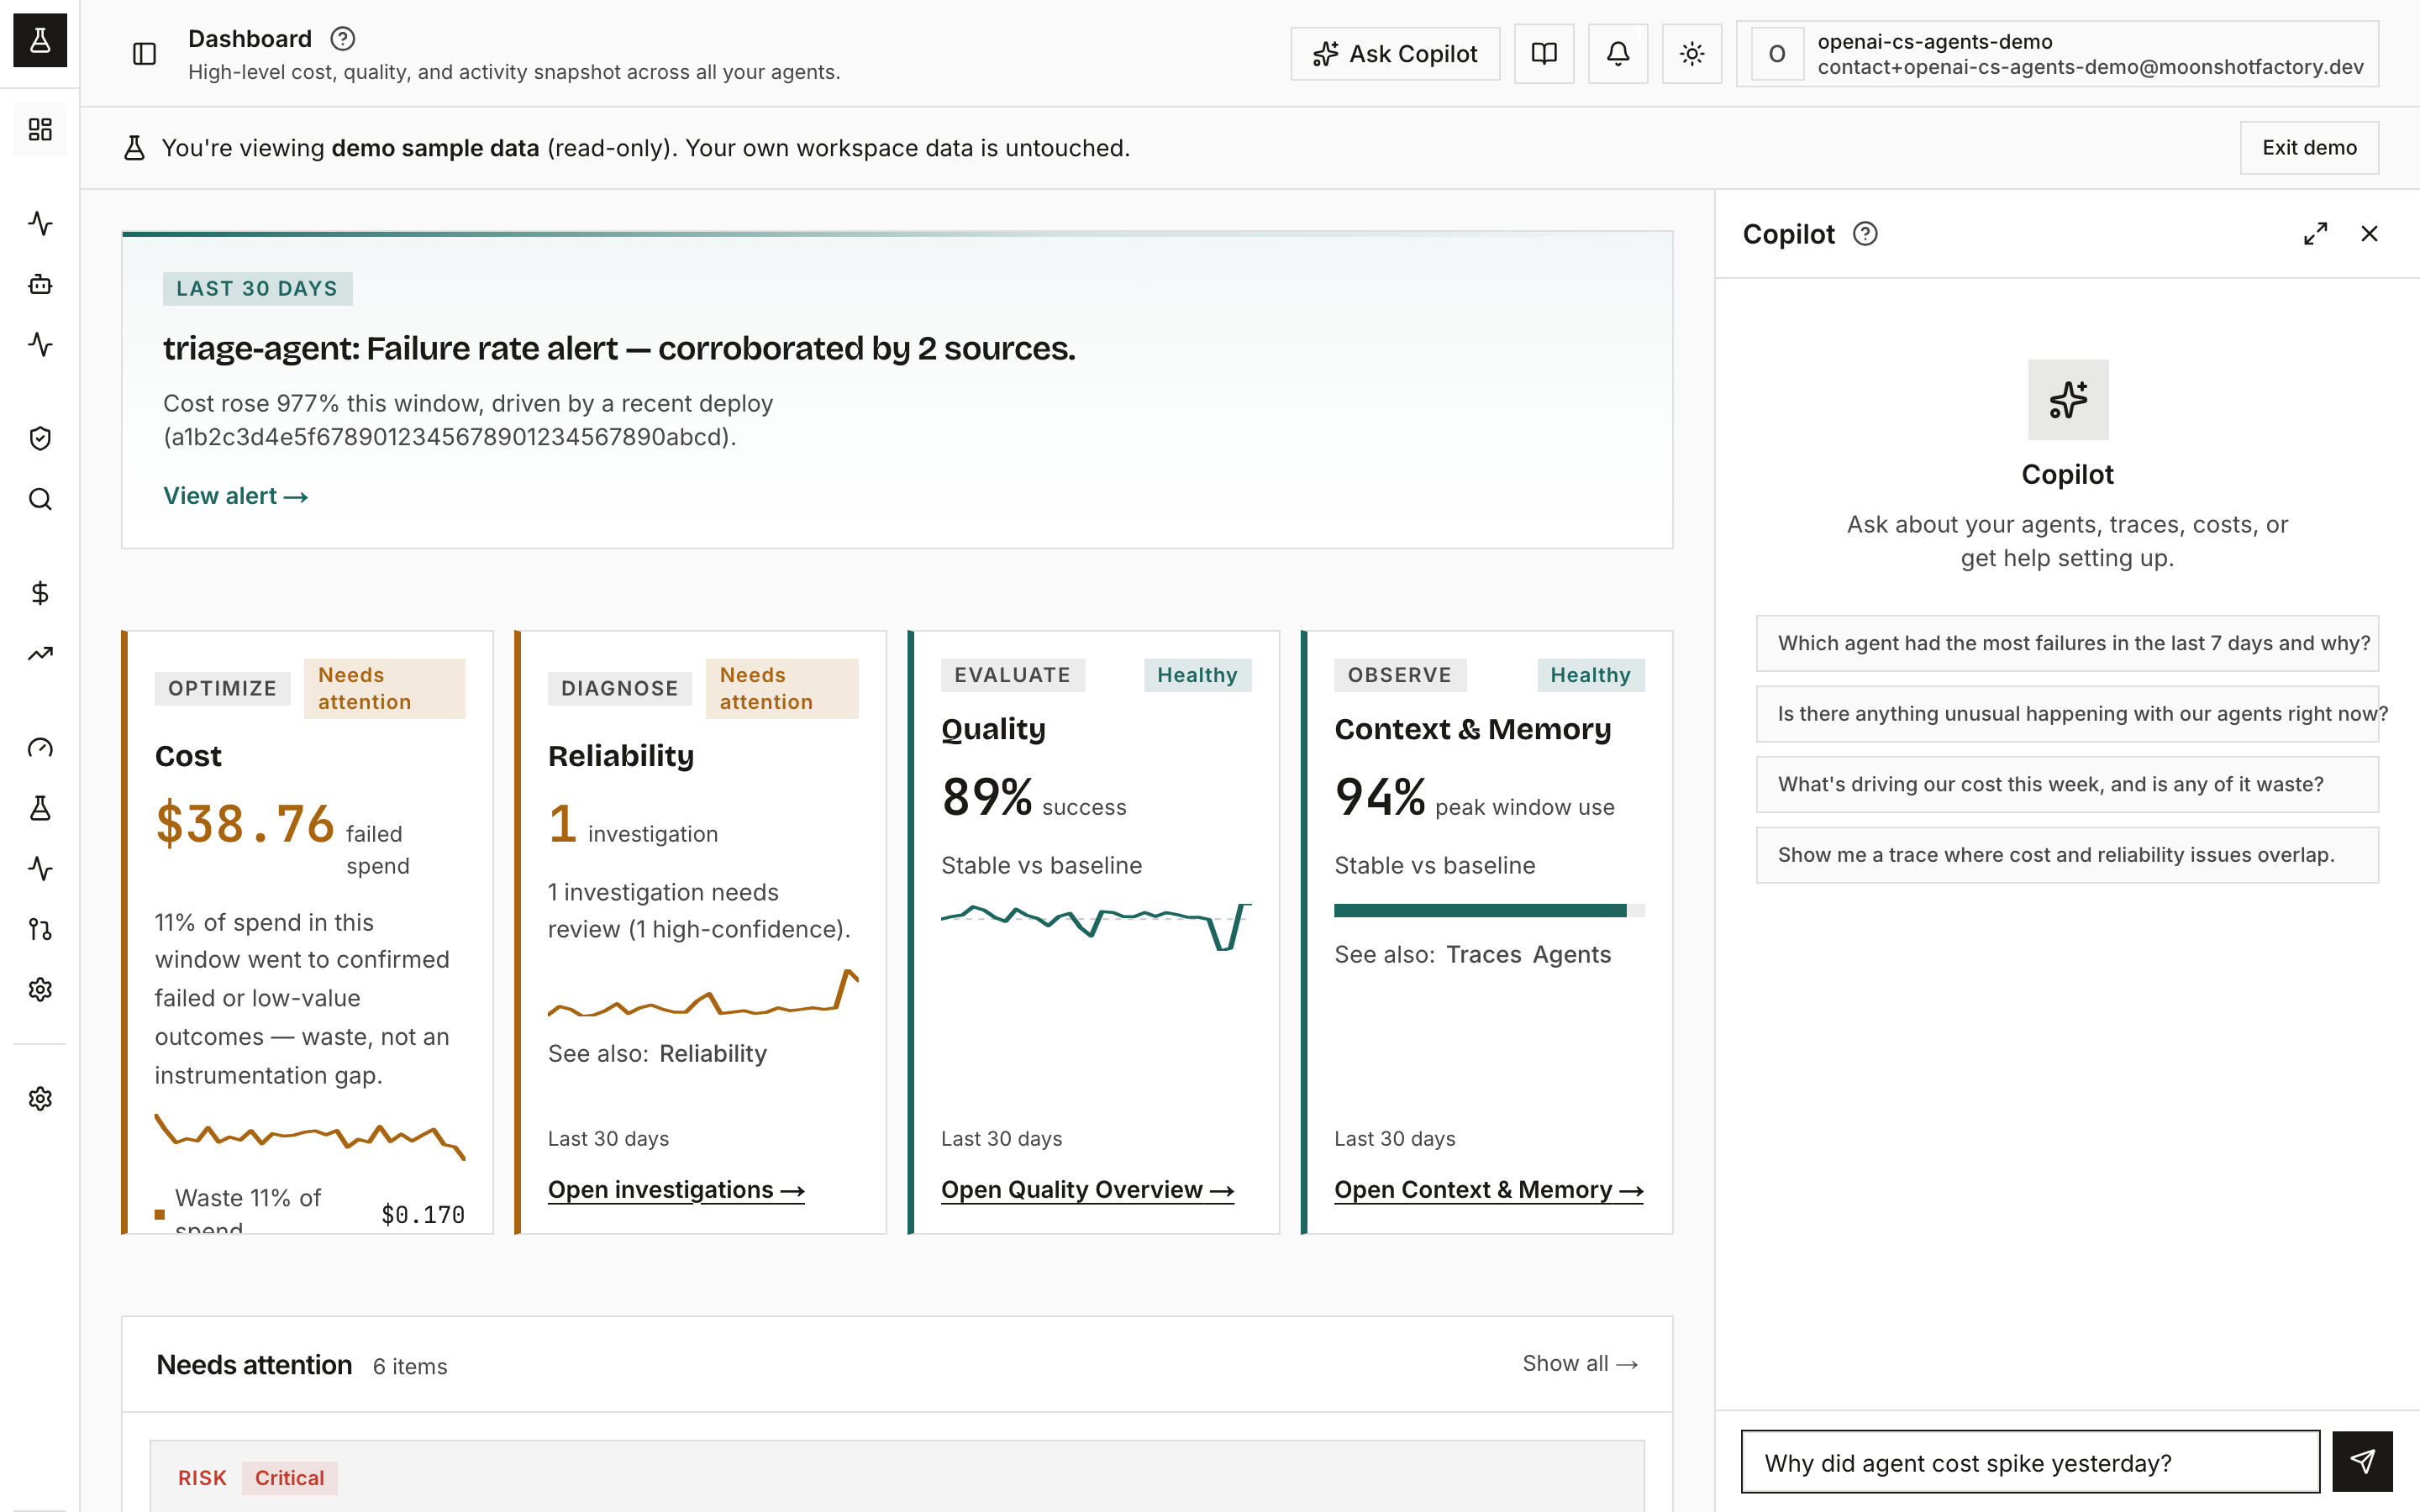
What you see
Copilot is a panel, not a route — it rides along on top of whatever page you’re already on.
Docked, floating, and mobile
Three layout modes: docked (a 420px right rail, non-modal — the page reflows around it), floating (a centered modal roughly 80% of the viewport, opened with a maximize button), and mobile (a near-fullscreen modal; there’s no useful docked state on a small screen, so the maximize toggle is hidden).
A header carries the “Copilot” title plus maximize/minimize and close controls.
Open it from the Ask Morse trigger in the dashboard header, or a keyboard shortcut.
Doc mode and data mode
Two modes decide what Morse can answer, and the switch is automatic — there’s nothing to toggle. On every request, the backend checks whether your org has any trace data yet:
- No trace data: Morse answers from a product/SDK docs corpus only — setup and how-it-works questions, not your own data.
- Any trace data: Morse gets the full tool set — your traces, agent stats, costs, logs, alerts, and the same investigations and risk analysis the dashboard itself shows.
The mode check runs per request, not once per session — a workspace can flip from doc mode to data mode mid-conversation the moment its first trace lands, with no action from you.
Before you have any data, try a starter prompt from the empty state. Once you have traces, ask things like: “Hey Morse, why did cost spike on the billing agent in the last 24h?”
Streaming responses
Replies stream in as Morse works — you see each reasoning and tool step appear in order, then the answer typing in, rather than a spinner followed by a wall of text.
Explain a trace
On a trace’s detail page, an Explain button sends that trace straight to Morse’s
explain_agent_dag tool, which classifies its orchestration into one of six known patterns — ReAct,
plan-execute-reflect, hierarchical multi-agent, sequential pipeline, map-reduce, or single-shot —
or flags it as unrecognized rather than forcing a guess.
How to use it
- Open the panel from the header trigger or the keyboard shortcut; toggle docked and floating as you work.
- Type a question, or click a starter prompt to send it as-is.
- Watch the step list while Morse works — each tool call it makes shows up as it happens.
- From a trace’s detail page, click Explain to get an orchestration-pattern read without typing a question.
Morse is hardened against prompt injection: an input scanner and rate limiting (20 requests per minute) run before your message reaches the model, and an output classifier plus a canary token check for prompt leakage on the way back. A blocked message returns a generic error, not a detailed reason.
Before you have data
With zero traces in your org, Morse doesn’t pretend to have data-mode answers — it stays in doc mode and answers setup and product questions from the docs corpus instead. The moment one trace exists, the very next message you send unlocks the full tool set.
To get your first trace here, follow the quickstart.
Related
- Traces — “Explain cohort” there sends a cohort summary into this same panel.
- Trace detail — where the per-trace Explain button lives.