Incident
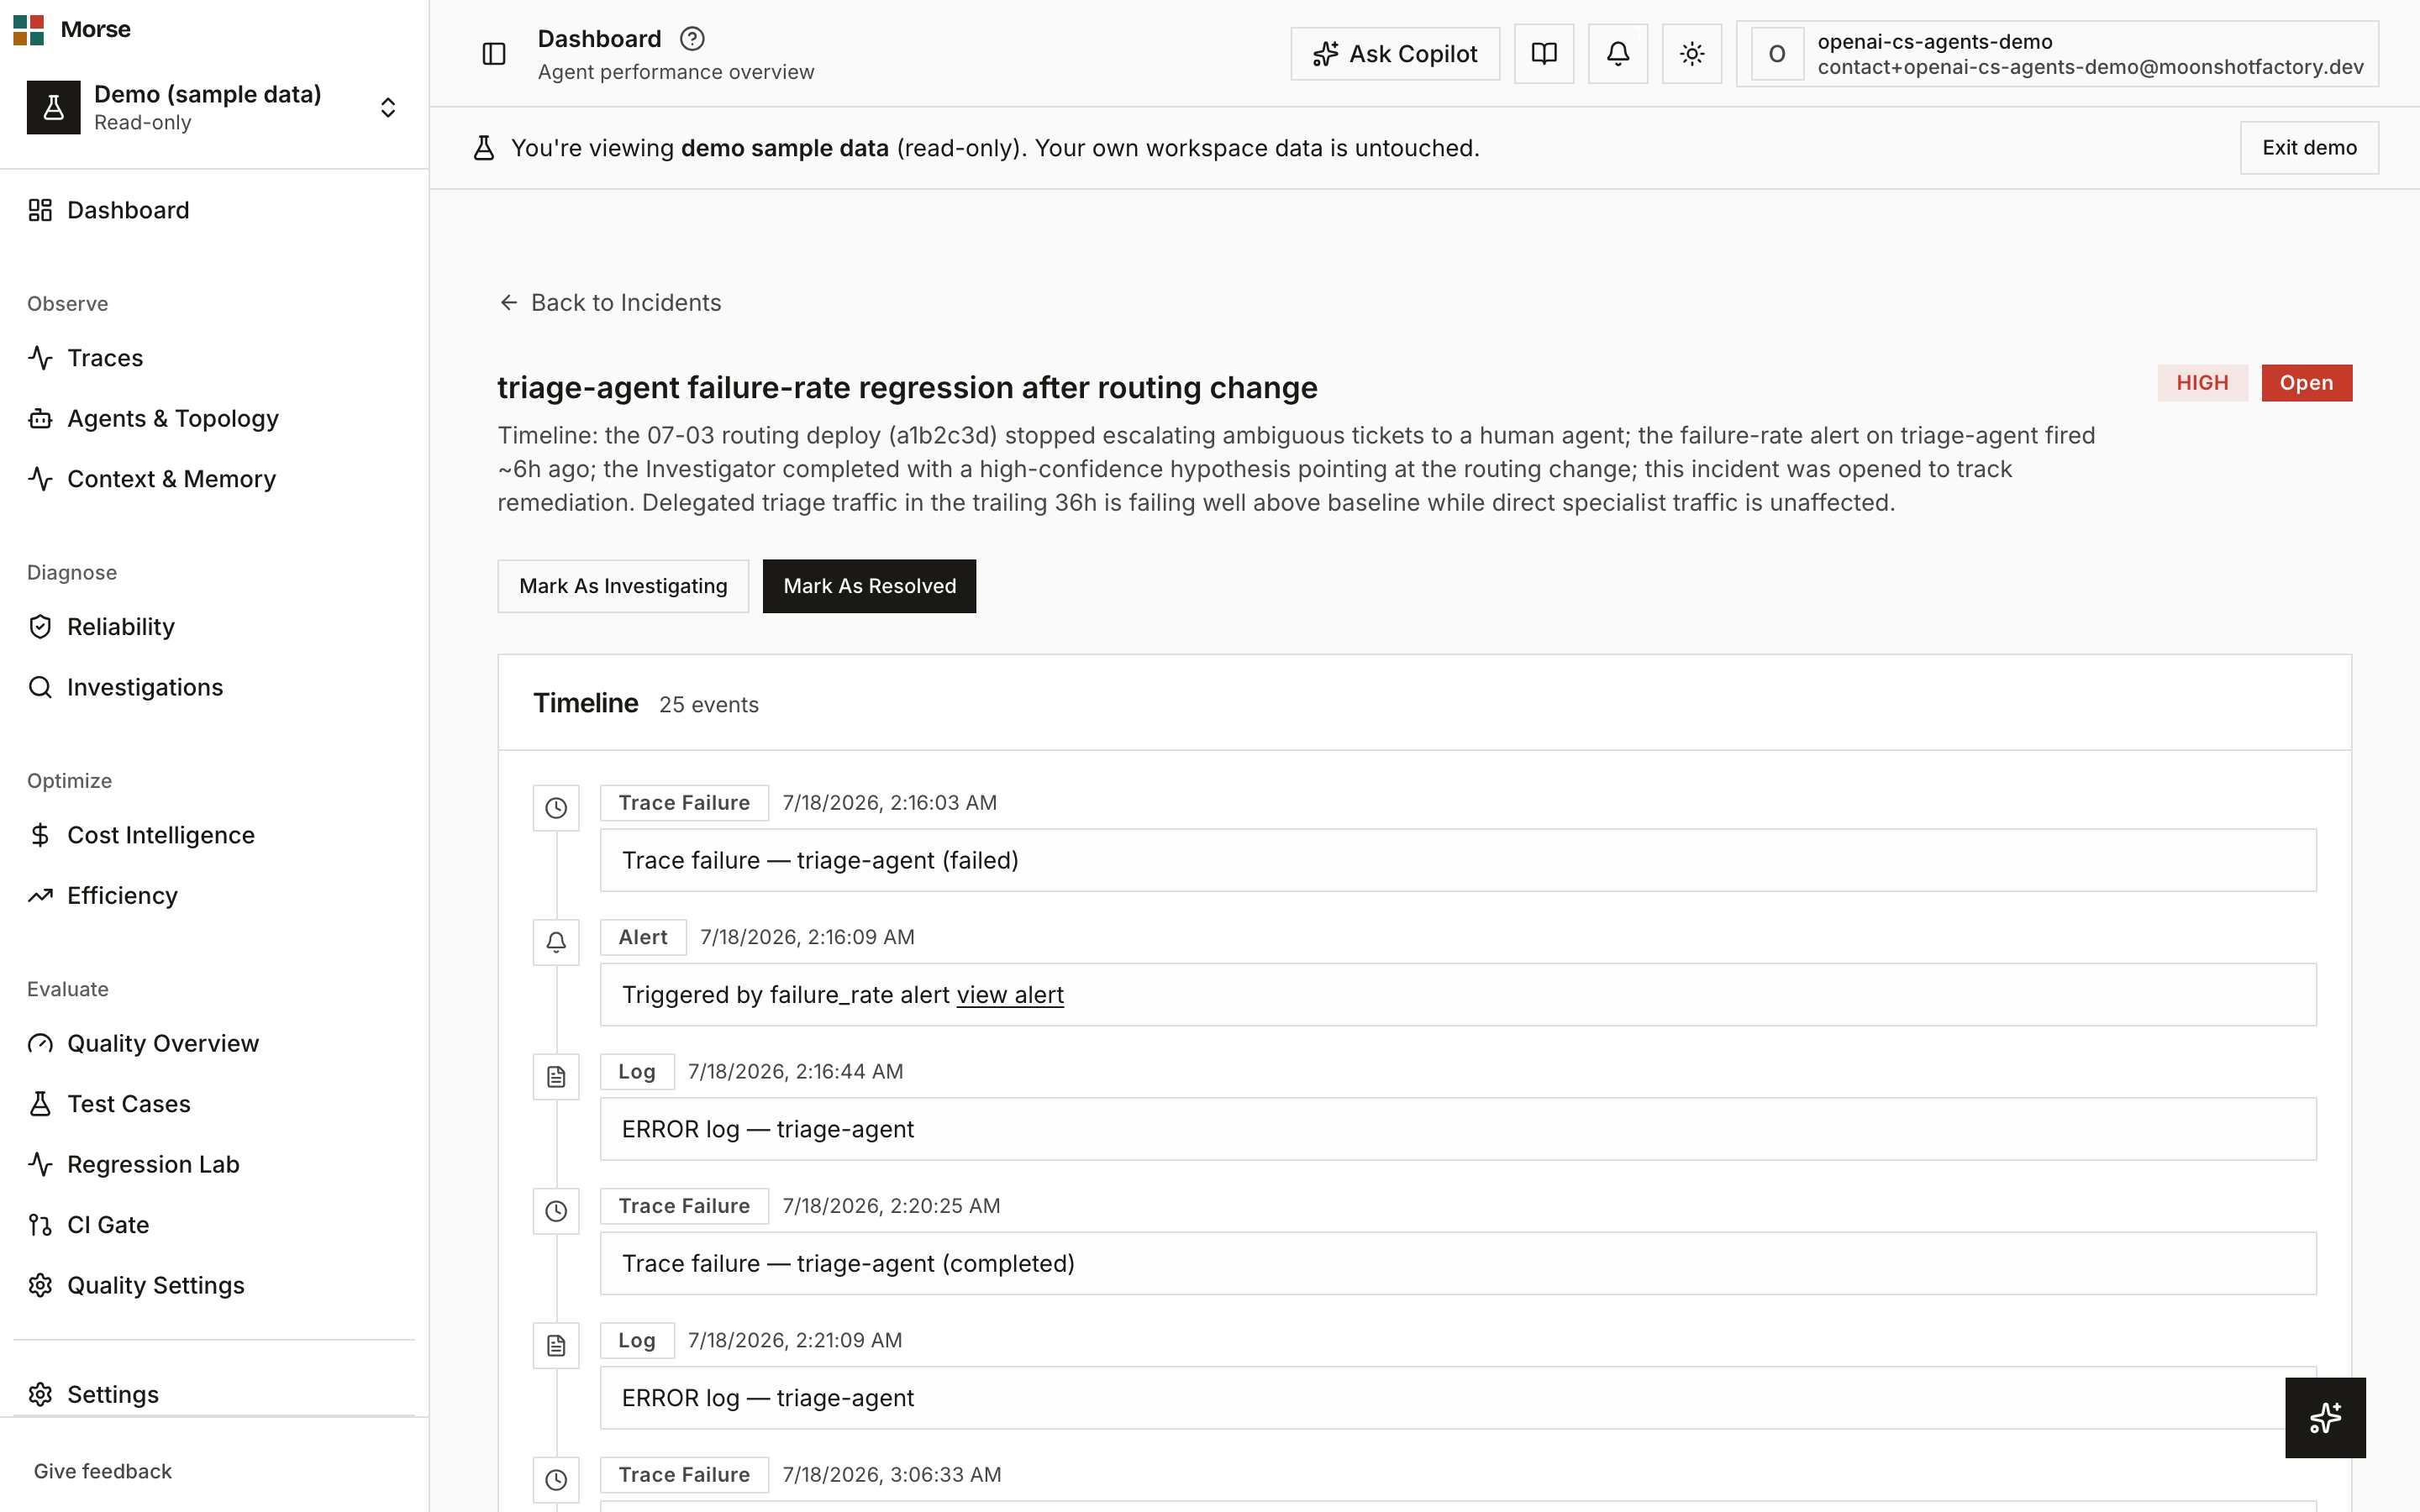
Opens from an incident row on the Reliability Incidents tab. It’s the record of something that already happened — a header, status transitions, and a chronological timeline of everything that led up to it.
What you see
Header
Title, summary, a severity badge (critical/high/medium/low), and a status badge (open/investigating/resolved).
Status transitions
A row of status-transition buttons — one for each status actually reachable from the current one. Open incidents show “investigating” and “resolved”; investigating shows only “resolved”; resolved shows none, since it’s terminal.
This list comes from the API, not a client-side state machine.
Timeline
A chronological list of events — alert firings, trace failures, metric anomalies, and status changes — each with an icon and a one-line label.
An alert-sourced event carries a view alert link straight to that alert’s detail page, so the alert that actually triggered the incident is one click away instead of buried in raw event JSON.
How to use it
- Click an available Mark as… button to move the incident’s status forward; the button set narrows as the incident progresses toward resolved.
- Follow a timeline entry’s view alert link to jump to the alert that fired it.
- Use Back to Incidents to return to the Incidents tab.
Before you have data
If the incident has no timeline events yet, the Timeline panel shows “No timeline events yet” instead of an empty list.
If the incident id doesn’t resolve, the page shows an “Incident not found” message in place of the header and timeline.
Related
- Reliability — the Incidents tab this page opens from.
- Alert — where a timeline’s “view alert” link leads.